bullish
🔹 Technical analysis according to Elliott waves (time: 1 hour)
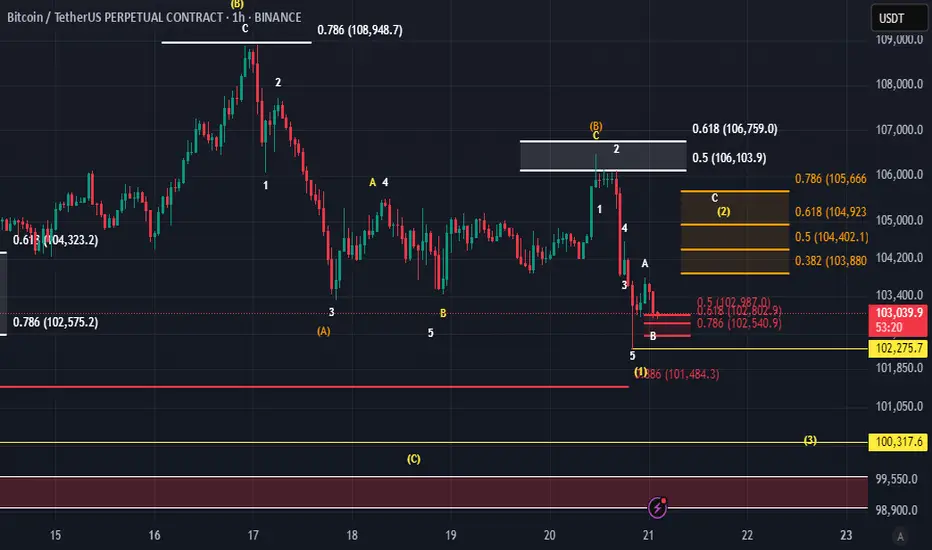
📌 The pattern shown on the chart shows a complex structure that includes a complex correction within the larger wave (B), and the following is clear:
🔸 Main waves:
Wave (1) up from the bottom has been confirmed.
It was followed by a corrective wave (2) that ended near the 0.786 Fibonacci level = 102,575.
Then the upward wave (3) started, and it seems that it has been completed or is about to be completed.
🔸 Current status:
The price is currently moving within a small corrective wave, likely wave (4).
Current major support is located at: 🔸 102,275.7 (very important level) 🔸 100,317.6 (in case the correction extends)
🔸 Critical resistance areas:
For the bullish scenario to be valid, the resistance must be broken:
106,759 (0.618 Fibonacci ratio)
108,948 (0.786 – peak of wave C)
---
🔹 Important technical points:
🔸 The last correction (A)-(B)-(C) shows a clear triple structure, indicating that wave (2) has been completed.
🔸 The price is currently bouncing off the 0.5 - 0.618 Fibonacci levels (104,402 - 104,923), which reinforces the possibility that wave (2) has actually ended, and that we are currently starting an upward wave (3).
---
✅ Conclusion:
✅ As long as the price is above 102,275, the upward scenario through wave (3) remains valid.
⚠️ Breaking 100,317 indicates the failure of the bullish scenario and a structural shift in the waves.
🔻 Alternative (Bearish) Scenario – Short-Term:
If the price fails to maintain the current support at 102,275, we may not be in wave (4) but rather at the beginning of a new downward wave within a broader corrective scenario, as follows:
---
🔸 Wave Interpretation:
🔹 Wave (B), which completed at the peak near 108,948, likely marked the end of an upward correction.
🔹 The current downward wave from that peak could be:
Either wave 1 of C within a larger correction,
or the beginning of wave (C) within a bearish (A)-(B)-(C) pattern.
---
🔻 Potential Downside Targets in This Scenario:
1. Breaking 102,275 = Confirmation of the beginning of a new downward wave.
2. First Target:
🔸 101,484 (1.618 Fibonacci Extension – Wave 1 Expected)
3. Second and Stronger Target:
🔸 100,317 = Previous Major Support, Representing an Important Structural Test Area.
4. Third and Most Extreme Target in This Scenario:
🔸 98,800 – 99,260 = Possible Wave C Extension (Corresponds to a Larger Downside Scenario).
---
⚠️ Failure Signal:
Remaining below 105,926 (Previous Sub-Wave Resistance) maintains selling pressure.
Any weak bounce and lack of a clear wave 5 upwards = an additional sign of bearish dominance.
---
🔻 Conclusion:
✳️ The bearish scenario assumes that the peak at 108,948 was the end of corrective wave (B), and that we are now in a downward wave C targeting areas between 101,400 and 99,200, and possibly lower.
✳️ A break of 102,275 would be key to activating this scenario.
Disclaimer
The information and publications are not meant to be, and do not constitute, financial, investment, trading, or other types of advice or recommendations supplied or endorsed by TradingView. Read more in the Terms of Use.
Disclaimer
The information and publications are not meant to be, and do not constitute, financial, investment, trading, or other types of advice or recommendations supplied or endorsed by TradingView. Read more in the Terms of Use.