🕐 1-Hour Overview:
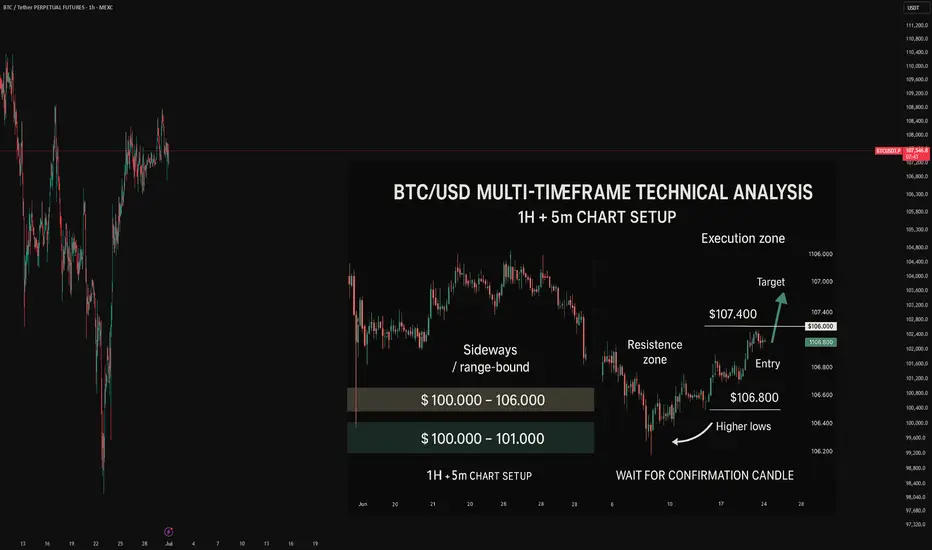
BTC is currently consolidating inside a range-bound structure, showing signs of indecision.
Resistance Zone: $105,000 – $106,000
Support Zone: $100,000 – $101,000
The price must break out of this box to define the next major direction.
➡️ A bullish breakout above 106K could lead to $108K+
⬅️ A breakdown below 100K may trigger downside momentum.
⏱ 5-Minute Execution Zone:
The 5m chart shows a rebound from an oversold move, forming higher lows and approaching key resistance.
Minor Resistance: $107,000
Key Breakout Level: $107,400
🎯 Trading Scenario:
If we get a strong bullish candle closing above $107,400
Then: Entry Long with target near $108,000
Stop Loss: Below recent 5m low – around $106,800
✅ Strategy Context:
Timeframe alignment between HTF and LTF
Scalp entry with confirmation
Risk managed around structural zones
🔗 Powered by ALIP FX
📌 Follow for more ideas, and smart scalping setups
#Bitcoin #BTCUSD #Scalping #PriceAction #ALIPFX
Disclaimer
The information and publications are not meant to be, and do not constitute, financial, investment, trading, or other types of advice or recommendations supplied or endorsed by TradingView. Read more in the Terms of Use.
Disclaimer
The information and publications are not meant to be, and do not constitute, financial, investment, trading, or other types of advice or recommendations supplied or endorsed by TradingView. Read more in the Terms of Use.