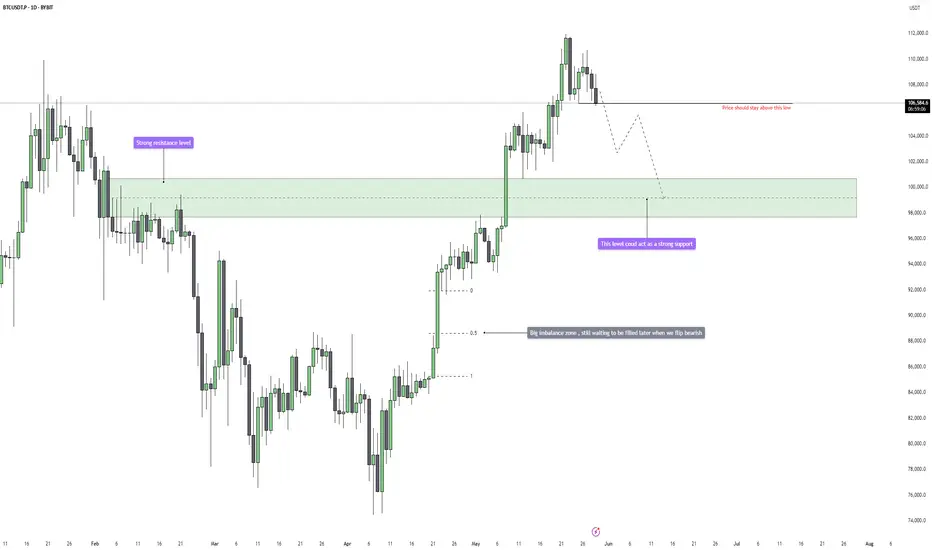
Bitcoin is showing its first real signs of weakness after an extended bullish run. The current price action around $106,700 suggests a loss of momentum, with price hovering just above a key daily low that could act as a pivot point. If this low gets taken out, it would likely mark a short-term shift in sentiment from bullish to bearish, opening the door for a deeper retracement toward key inefficiency zones that remain unfilled.
Consolidation and Liquidity Structure
After the sharp breakout in early May, price rallied aggressively with minimal pullbacks, leaving behind several imbalance zones that now act as downside magnets. The previous range high around $99,000, which acted as a strong resistance level earlier this year, has not yet been properly retested. This area aligns with a large daily imbalance, making it a highly probable target in the event of a breakdown. Currently, price is consolidating just above this previous resistance-turned-support zone, and pressure is building.
Bearish Breakdown Potential
If the current daily low breaks, it would likely trigger a flush into the $99,000 to $95,000 range, where we find that unfilled imbalance waiting to be closed. A break and acceptance below the $99,000 level could suggest deeper trouble for the bulls. In that case, the next major downside target sits around $92,000, where an even larger inefficiency from earlier in the year remains open. This level also coincides with a significant accumulation zone that could provide the next strong base of support if the market continues correcting.
Bullish Recovery Conditions
On the flip side, if Bitcoin holds this low and finds demand stepping in at current levels, we could see a local bottom form. A recovery and push back toward $108,000 or even a reattempt of the $112,000 highs would be back on the table. But for this bullish case to stay alive, the current daily low must hold. A sweep and reclaim could trap late sellers and fuel a quick reversal. However, right now, the pressure is clearly leaning to the downside unless buyers show strong intent soon.
Imbalance Zones and Key Price Areas
The most critical area to watch is the $99,000 level. It’s the confluence of an old resistance, an unfilled imbalance, and psychological round number support. If price tags this zone, we’ll need to monitor reaction closely. Weakness below $99,000 opens the door to $92,000, which is where the next higher timeframe imbalance sits. If we start accepting below $92,000, that would confirm a much more extended corrective phase is underway.
Price Target and Expectations
The primary expectation is a move into the $99,000 imbalance zone, assuming we get a clean daily low break. A bounce there would offer the first chance for a bullish reaction, but if sellers dominate, $92,000 becomes the secondary and more extreme downside target. A reclaim of $108,000 would invalidate this short-term bearish thesis and shift the focus back toward the highs.
Conclusion
All eyes are on the daily low. A clean break below it would change the tone of this market and likely initiate a short-term bearish cycle, targeting inefficiencies left behind during the rally. $99,000 is the key zone to watch first. If it holds, bulls may step back in. If not, $92,000 becomes the next target in line. For now, caution is warranted as the risk of deeper downside continues to grow.
___________________________________
Thanks for your support!
If you found this idea helpful or learned something new, drop a like 👍 and leave a comment, I’d love to hear your thoughts! 🚀
Trade active
Bitcoin broke below the low, looking for more downside𝟔 𝐘𝐄𝐀𝐑𝐒 𝐄𝐗𝐏𝐄𝐑𝐈𝐄𝐍𝐂𝐄𝐃 𝐓𝐑𝐀𝐃𝐄𝐑
💎 Free Signals
t.me/codeandcandle
🎁 Free trading Discord community
bit.ly/TehThomas
🥇 Best exchange - 20% cashback
bit.ly/BloFin20
💎 Free Signals
t.me/codeandcandle
🎁 Free trading Discord community
bit.ly/TehThomas
🥇 Best exchange - 20% cashback
bit.ly/BloFin20
Related publications
Disclaimer
The information and publications are not meant to be, and do not constitute, financial, investment, trading, or other types of advice or recommendations supplied or endorsed by TradingView. Read more in the Terms of Use.
𝟔 𝐘𝐄𝐀𝐑𝐒 𝐄𝐗𝐏𝐄𝐑𝐈𝐄𝐍𝐂𝐄𝐃 𝐓𝐑𝐀𝐃𝐄𝐑
💎 Free Signals
t.me/codeandcandle
🎁 Free trading Discord community
bit.ly/TehThomas
🥇 Best exchange - 20% cashback
bit.ly/BloFin20
💎 Free Signals
t.me/codeandcandle
🎁 Free trading Discord community
bit.ly/TehThomas
🥇 Best exchange - 20% cashback
bit.ly/BloFin20
Related publications
Disclaimer
The information and publications are not meant to be, and do not constitute, financial, investment, trading, or other types of advice or recommendations supplied or endorsed by TradingView. Read more in the Terms of Use.