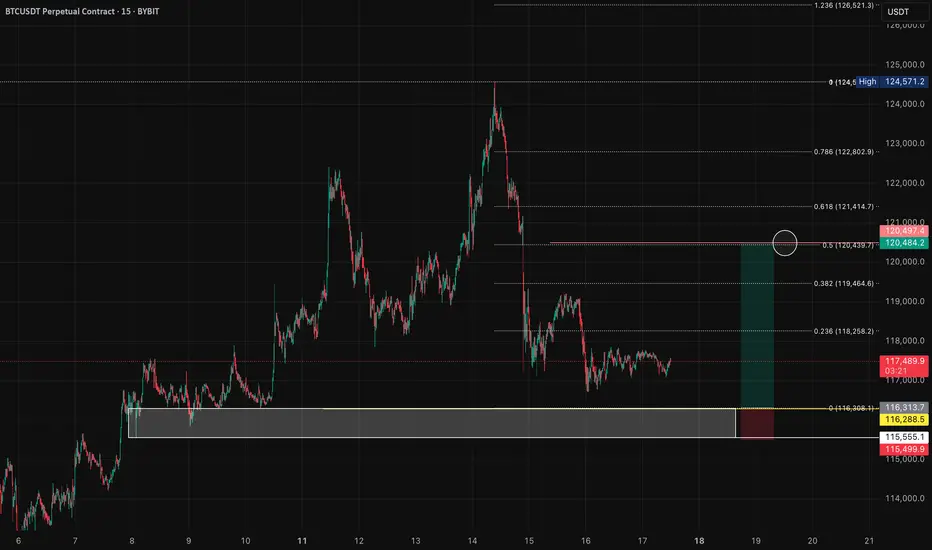
📊 If price drops into the white boxed area, I'm looking for a long entry.
But… there's a chance we sweep the lows near $115,555 first before moving up — so avoid blind limit buys. I'll wait for a reaction at the yellow line before entering.
🎯 I'm expecting price to hunt for liquidity around the white box area — essentially targeting stop losses from less experienced traders — before making its move higher.
This isn't necessarily based on strict technical logic, but rather from years of trading experience watching how these patterns typically unfold.
⚠️ **Setup is invalid if:**
• Move happens before this week's weekly candle closes
• Price breaks below the white box
• Price pumps without returning to the box
🚀 If we get this move early next week, I'm targeting at least the blue circled zone.
ATH is possible, but conservatively I'll take profits there.
📈 This trade setup offers a risk-to-reward ratio of 5:1. Without including fees, the breakeven win rate for this trade would be approximately 16.67%.
Knowing these figures in advance helps me avoid emotional trading.
💡 If you often find yourself trading based on emotions, I recommend doing this type of pre-planning and quantifying your setups before execution — it can be a simple yet highly effective improvement.
---
**Trading is simple.** You don't need multiple indicators or dozens of lines on your chart. A clean and simple chart often works best — it keeps your decisions consistent and reduces uncertainty.
Sure, it might not look flashy, and my analysis may seem a bit "plain" compared to others… but that's how I like it.
If you find this analysis useful, feel free to follow me for more updates.
---
*Disclaimer: This post is for general informational and educational purposes only. It does not constitute financial advice, investment recommendation, or a service targeting specific investors, and should not be considered illegal or restricted information in any jurisdiction.*
Note
By the way, I think there's a possibility it could fall to $105,000 after rising to around $120,500.Disclaimer
The information and publications are not meant to be, and do not constitute, financial, investment, trading, or other types of advice or recommendations supplied or endorsed by TradingView. Read more in the Terms of Use.
Disclaimer
The information and publications are not meant to be, and do not constitute, financial, investment, trading, or other types of advice or recommendations supplied or endorsed by TradingView. Read more in the Terms of Use.