Weekly Chart
BTC is still trading inside the macro range at $111,959.5–$119,655.0. Last week closed green but as an inside bar, which signals indecision. We also printed a failed auction above the prior higher-high vLevel—hinting at trend fatigue and the risk of a deeper pullback.
As long as price holds $111,959.5, the broader bullish structure is intact. A weekly close below $111,959.5 would likely open room toward the next vLevel near $98,115.4. Until this range resolves, expect two-sided trade and respect the extremes.

Daily Chart
Today’s candle closed as a shooting star (bearish pin bar) with elevated Relative Volume (RVOL), a classic reversal signal at resistance. On the Footprint, delta finished negative and, more importantly, VAH, VAL, and the POC all sit inside the upper wick, which tells us most of the trading occurred near the highs. That’s typical of late longs getting trapped.
With the daily trend pointing lower, the base case is a rotation toward the $111,910 vLevel. Until conditions change, treat bounces as opportunities to stay aligned with the bearish daily momentum.

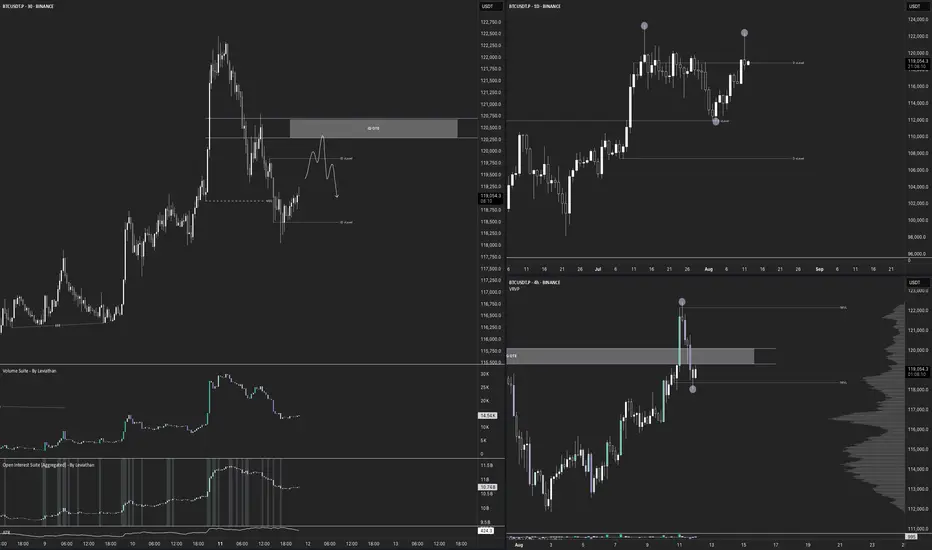
12-Hour Chart
Structure is still bullish, but this push looks more like a liquidity sweep above the prior range highs, right where most short stops sit; than true initiative buying. If we fail to gain acceptance above the breakout and rotate back inside the range with sell-delta/absorption at the highs, I’ll treat it as a failed auction and look for rotation back toward the range low.

4-Hour Chart
After a clean macro Over/Under, the 4-hour has rotated back into the SWING OTE zone, exactly where I want to be stalking shorts. Despite the 4H still reading structurally bullish, price is boxed inside $118 395.8–$122 165.4 and keeps showing responsive selling into the upper range. For a swing short, the key now is the 30-minute: Invalidation is acceptance above $122 165.4; below that, the short idea stays in play. We’ll break down the 30-min setup next.

30-Minute Chart
The 30-minute is flashing a clean spike in both CVD and Open Interest, fresh longs chased the intraday pump. Best case from here is a full fade of that impulse, turning late buyers into exit fuel. Leverage looks elevated, so a liquidity flush is very much on the table if price can’t hold acceptance above the spike. I’m placing limit shorts inside the intraday OTE zone with my stop just above 122 165.4.

BTC is still trading inside the macro range at $111,959.5–$119,655.0. Last week closed green but as an inside bar, which signals indecision. We also printed a failed auction above the prior higher-high vLevel—hinting at trend fatigue and the risk of a deeper pullback.
As long as price holds $111,959.5, the broader bullish structure is intact. A weekly close below $111,959.5 would likely open room toward the next vLevel near $98,115.4. Until this range resolves, expect two-sided trade and respect the extremes.
Daily Chart
Today’s candle closed as a shooting star (bearish pin bar) with elevated Relative Volume (RVOL), a classic reversal signal at resistance. On the Footprint, delta finished negative and, more importantly, VAH, VAL, and the POC all sit inside the upper wick, which tells us most of the trading occurred near the highs. That’s typical of late longs getting trapped.
With the daily trend pointing lower, the base case is a rotation toward the $111,910 vLevel. Until conditions change, treat bounces as opportunities to stay aligned with the bearish daily momentum.
12-Hour Chart
Structure is still bullish, but this push looks more like a liquidity sweep above the prior range highs, right where most short stops sit; than true initiative buying. If we fail to gain acceptance above the breakout and rotate back inside the range with sell-delta/absorption at the highs, I’ll treat it as a failed auction and look for rotation back toward the range low.
4-Hour Chart
After a clean macro Over/Under, the 4-hour has rotated back into the SWING OTE zone, exactly where I want to be stalking shorts. Despite the 4H still reading structurally bullish, price is boxed inside $118 395.8–$122 165.4 and keeps showing responsive selling into the upper range. For a swing short, the key now is the 30-minute: Invalidation is acceptance above $122 165.4; below that, the short idea stays in play. We’ll break down the 30-min setup next.
30-Minute Chart
The 30-minute is flashing a clean spike in both CVD and Open Interest, fresh longs chased the intraday pump. Best case from here is a full fade of that impulse, turning late buyers into exit fuel. Leverage looks elevated, so a liquidity flush is very much on the table if price can’t hold acceptance above the spike. I’m placing limit shorts inside the intraday OTE zone with my stop just above 122 165.4.
Let's DeCode the markets together,
Bast.
Bast.
Disclaimer
The information and publications are not meant to be, and do not constitute, financial, investment, trading, or other types of advice or recommendations supplied or endorsed by TradingView. Read more in the Terms of Use.
Let's DeCode the markets together,
Bast.
Bast.
Disclaimer
The information and publications are not meant to be, and do not constitute, financial, investment, trading, or other types of advice or recommendations supplied or endorsed by TradingView. Read more in the Terms of Use.