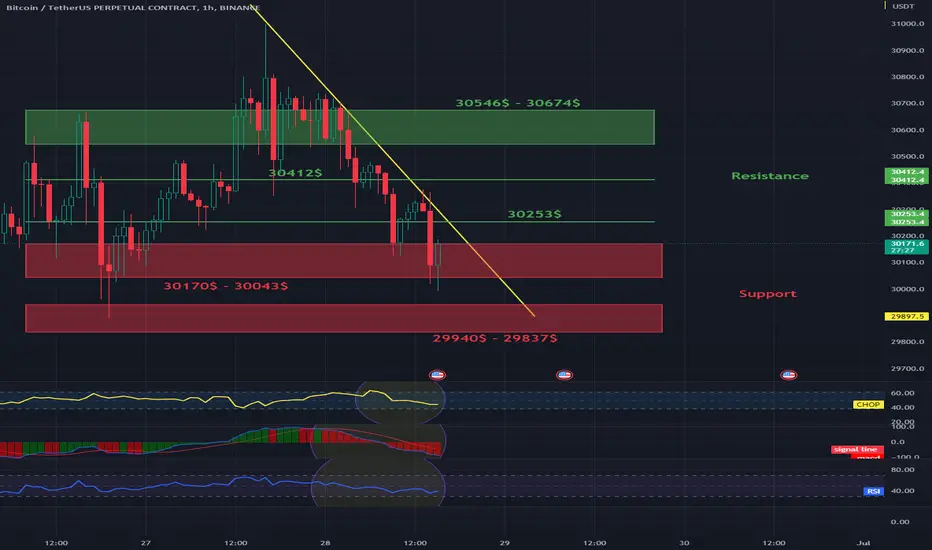
Hello everyone, let's look at the BTC to USDT chart on a 1-hour timeframe. As you can see, the price is moving below the local downtrend line.
Let's start with setting the support for the next few hours and here we first have a support zone from $30170 to $30043, which held the price, but then we have a second support zone from $29940 to $29837.
Now let's move on to the resistance, as you can see the first resistance is $30253, if it breaks down the next resistance will be $30412 and then we have a strong resistance zone from $30546 to $30674.
Looking at the CHOP indicator, we see that there is still some energy left, the MACD indicates a continuation in the downtrend, while the RSI is moving at the lower limit, however, small movements can bring the price to the second support zone.
Disclaimer
The information and publications are not meant to be, and do not constitute, financial, investment, trading, or other types of advice or recommendations supplied or endorsed by TradingView. Read more in the Terms of Use.
Disclaimer
The information and publications are not meant to be, and do not constitute, financial, investment, trading, or other types of advice or recommendations supplied or endorsed by TradingView. Read more in the Terms of Use.