BTC (4H) — post-breakdown short. Price lost the rising structure and the long up-trendline, then failed a retest into a heavy confluence zone (Fib 0.382–0.5 at 119,783–118,384 plus supply under ~120k–121.6k). Market is now printing lower highs/lows toward Fib extensions 1.272 → 1.414 → 1.618 at 108,629 → 106,849 → 104,293. Invalidation on a sustained reclaim of 121.6–122.1k.
What your image shows, step by step
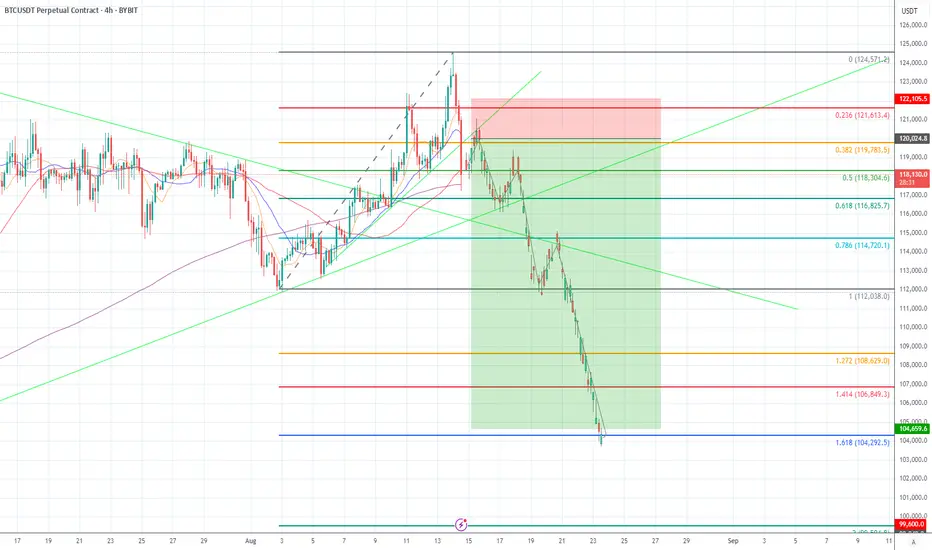
Timeframe & instrument: BTCUSDT Perpetual, 4-hour (Bybit).
Structure break: A steep, dashed rising channel/wedge into the local high was impulsively broken. That drop also cut through the green diagonal up-trendline, turning it from support into resistance.
Failed retest (confluence): Price bounced back only to stall below a tight cluster:
Fib 0.382 @ 119,783 and 0.5 @ 118,384,
the prior up-trendline (now resistance),
and the 0.236 @ 121,613 just above.
This is classic “break → retest → reject.”
Trend now: Clear lower highs and lower lows with an accelerating, dotted descending channel guiding the move.
Targets marked on your chart:
First support/target around the prior range base (~112,038), then
Fib extensions: 1.272 = 108,629, 1.414 = 106,849, 1.618 = 104,293 (blue line).
There’s even a deeper extension labeled near ~99,600 if momentum overshoots.
Trade box (your R:R):
Entry region: ~118.3k (post-retest failure).
Stop/invalid: 121.6–122.1k (red box, above 0.236 and supply).
Profit zone: down to ~104.7–104.3k (green box near 1.618).
That’s roughly a 3.5–4R idea to the main target.
Why BTC looks weak here (the logic behind the short)
Loss of key structure: Breaking a steep wedge and the major rising trendline, then failing to reclaim it, shifts control to sellers.
Bearish retest at resistance: The rejection happened where multiple resistances overlap (trendline + Fib 0.382/0.5 + supply under ~120–122k). Confluence rejections are high-quality short triggers.
Momentum & market structure: The sequence after the break is a textbook impulsive leg down → shallow bounce → continuation, confirming a down-trend on 4H.
Clear, mechanical targets: With the prior range supports gone, Fib extensions (1.272/1.414/1.618) provide objective downside magnets—exactly the levels you’ve plotted.
Asymmetry: Tight invalidation just above ~122k versus multi-thousand-dollar downside to ~108k/106k/104k creates attractive risk/reward for a tactical short.
How to read/defend the setup (concise playbook)
Bearish while: Price stays below 118.4–119.8k and can’t close back above the broken trendline.
Invalidation: Sustained reclaim above 121.6–122.1k (back inside the red box and above 0.236) = idea is wrong; flatten.
Take-profit ladder: 112.0k → 108.6k → 106.8k → 104.3k (move stops down as each level tags).
Bonus confirmation (if you want it): Another lower-high under ~120k or a clean 4H close below 116.8k (Fib 0.618) often accelerates the move.
Not financial advice—just a precise explanation of your chart and the short thesis it supports.
What your image shows, step by step
Timeframe & instrument: BTCUSDT Perpetual, 4-hour (Bybit).
Structure break: A steep, dashed rising channel/wedge into the local high was impulsively broken. That drop also cut through the green diagonal up-trendline, turning it from support into resistance.
Failed retest (confluence): Price bounced back only to stall below a tight cluster:
Fib 0.382 @ 119,783 and 0.5 @ 118,384,
the prior up-trendline (now resistance),
and the 0.236 @ 121,613 just above.
This is classic “break → retest → reject.”
Trend now: Clear lower highs and lower lows with an accelerating, dotted descending channel guiding the move.
Targets marked on your chart:
First support/target around the prior range base (~112,038), then
Fib extensions: 1.272 = 108,629, 1.414 = 106,849, 1.618 = 104,293 (blue line).
There’s even a deeper extension labeled near ~99,600 if momentum overshoots.
Trade box (your R:R):
Entry region: ~118.3k (post-retest failure).
Stop/invalid: 121.6–122.1k (red box, above 0.236 and supply).
Profit zone: down to ~104.7–104.3k (green box near 1.618).
That’s roughly a 3.5–4R idea to the main target.
Why BTC looks weak here (the logic behind the short)
Loss of key structure: Breaking a steep wedge and the major rising trendline, then failing to reclaim it, shifts control to sellers.
Bearish retest at resistance: The rejection happened where multiple resistances overlap (trendline + Fib 0.382/0.5 + supply under ~120–122k). Confluence rejections are high-quality short triggers.
Momentum & market structure: The sequence after the break is a textbook impulsive leg down → shallow bounce → continuation, confirming a down-trend on 4H.
Clear, mechanical targets: With the prior range supports gone, Fib extensions (1.272/1.414/1.618) provide objective downside magnets—exactly the levels you’ve plotted.
Asymmetry: Tight invalidation just above ~122k versus multi-thousand-dollar downside to ~108k/106k/104k creates attractive risk/reward for a tactical short.
How to read/defend the setup (concise playbook)
Bearish while: Price stays below 118.4–119.8k and can’t close back above the broken trendline.
Invalidation: Sustained reclaim above 121.6–122.1k (back inside the red box and above 0.236) = idea is wrong; flatten.
Take-profit ladder: 112.0k → 108.6k → 106.8k → 104.3k (move stops down as each level tags).
Bonus confirmation (if you want it): Another lower-high under ~120k or a clean 4H close below 116.8k (Fib 0.618) often accelerates the move.
Not financial advice—just a precise explanation of your chart and the short thesis it supports.
Disclaimer
The information and publications are not meant to be, and do not constitute, financial, investment, trading, or other types of advice or recommendations supplied or endorsed by TradingView. Read more in the Terms of Use.
Disclaimer
The information and publications are not meant to be, and do not constitute, financial, investment, trading, or other types of advice or recommendations supplied or endorsed by TradingView. Read more in the Terms of Use.