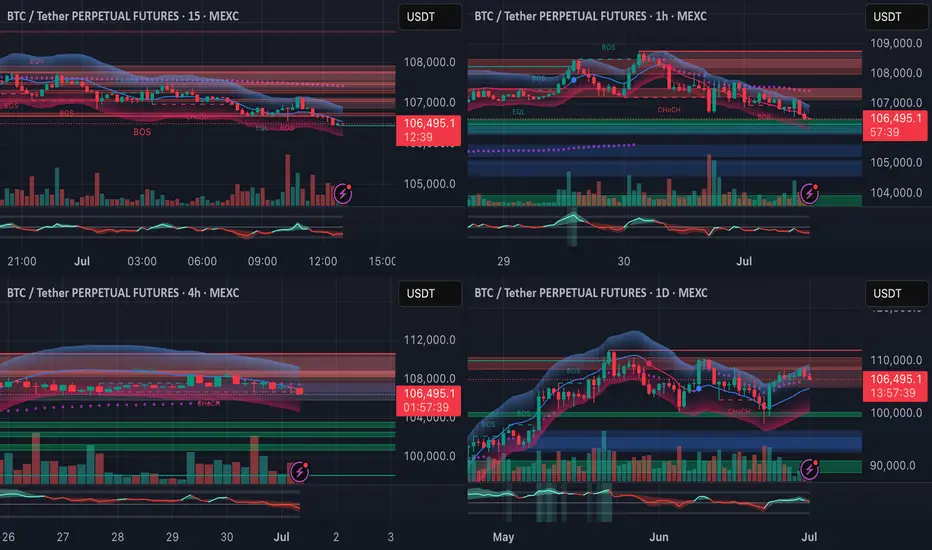
Analyzing BTCUSDT using 15m, 1h, 4h, and 1D timeframes.
Current structure shows a potential demand zone sweep followed by a reclaim setup.
Key confluences include:
RSI divergence forming on the 15m and 1h
Possible CHoCH on the 15m chart confirming bullish intent
Daily structure still intact as long as 106k holds
TP1, TP2, and SL levels are marked on the chart.
Monitoring closely for bullish confirmation before entry.
Trade what you see, not what you feel.
Disclaimer
The information and publications are not meant to be, and do not constitute, financial, investment, trading, or other types of advice or recommendations supplied or endorsed by TradingView. Read more in the Terms of Use.
Disclaimer
The information and publications are not meant to be, and do not constitute, financial, investment, trading, or other types of advice or recommendations supplied or endorsed by TradingView. Read more in the Terms of Use.