📌 Chart Summary
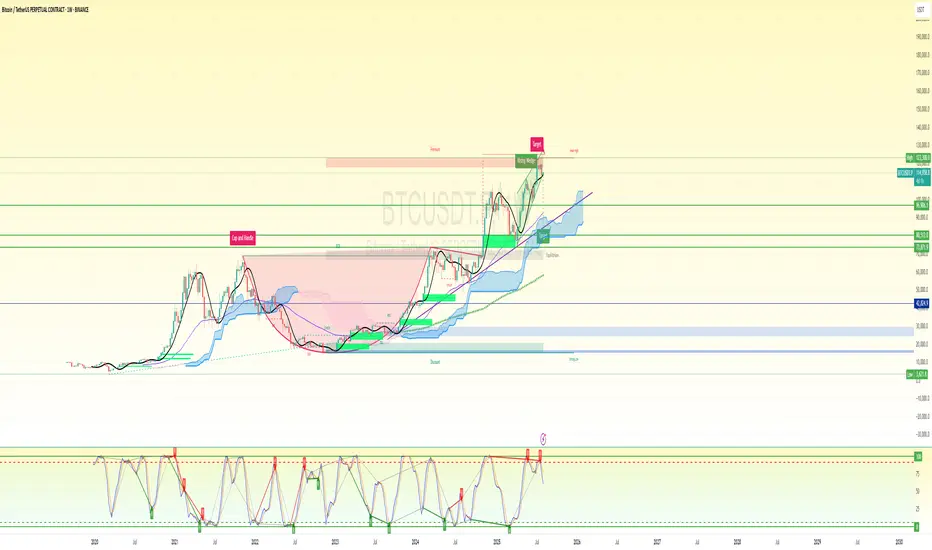
Price: ~$115,000
Pattern: Rising Wedge (Bearish)
Macro Structure: Completed Cup & Handle
Stochastic RSI: Overbought + Bearish cross confirmed
Ichimoku Cloud: Price far above cloud – extended
EMA/MAs: Bullish but overstretched
🧠 Bias-Free Most Probable Setup (Weekly Outlook)
🟥 Bearish Sniper Setup — High Probability
The chart is showing rising wedge exhaustion + Stoch RSI bear cross in extreme overbought = probable correction ahead.
🔽 Short Entry Plan (Sniper Setup)
Entry (Short): $114,200 – $116,000
Ideal sniper zone inside the wedge breakdown area / resistance rejection zone
Stop Loss: $123,000
Above wedge top and key psychological resistance
Take Profit 1 Range: $96,000 – $99,000
Previous major horizontal resistance zone and wedge support retest
Take Profit 2 (final target): $80,500 – $83,000
Major structure zone + Ichimoku cloud top + high-volume node
Risk:Reward: 1:3.5 to 1:5+
📈 Alternate Scenario: Bullish Breakout Setup (Low Probability but noted)
If BTC breaks and closes above $123,000 on weekly, wedge invalidates and opens target:
Breakout Target: $143,000 – $150,000
Based on wedge measured move + Fib extension
⚠️ Additional Confluences Supporting Bearish Bias:
Weekly RSI + Stoch RSI overbought and curling down
Rising wedge near exhaustion
Bearish divergence risk with higher highs in price, lower oscillator momentum
Volume is declining despite price rising – exhaustion signal
🧩 Strategic Notes:
Avoid longing here unless $123K clean break + volume spike
Best play = wait for confirmation of wedge breakdown to enter short
Leverage carefully – this is a macro weekly timeframe setup
Trade active
⏳ Estimated Duration for Setup Completion (Weekly Chart)Target Price Range Estimated Timeframe
TP1 Range $96,000 – $99,000 3–5 weeks
TP2 Range $80,500 – $83,000 5–9 weeks
🧠 Reasoning Behind Timeline
Weekly Candles move slower — each candle = 7 days. Major moves (20–30% drops) from similar patterns in BTC history typically take 3–6 weekly candles.
Stochastic RSI just crossed down = early signal. These usually take 3–4 candles to play through fully.
Liquidity below (TP1 zone) is a strong magnet — if breakdown confirms, acceleration could be sharp in the first few weeks.
TP2 depends on market sentiment, fundamentals (macro/Fed news), and whether TP1 bounce happens or not.
🚨 Important Notes:
A retest bounce after TP1 is likely before TP2 dump — allow for some chop in weeks 4–6.
Any weekly close above $123,000 invalidates this bearish setup — monitor weekly closes carefully.
Disclaimer
The information and publications are not meant to be, and do not constitute, financial, investment, trading, or other types of advice or recommendations supplied or endorsed by TradingView. Read more in the Terms of Use.
Disclaimer
The information and publications are not meant to be, and do not constitute, financial, investment, trading, or other types of advice or recommendations supplied or endorsed by TradingView. Read more in the Terms of Use.