Greetings, this is an update of our Elliott Wave Count for Bitcoin.
Today we are going to look at the bullish and bearish scenarios so everybody is well prepared for the upcoming price action.
We have seen a pullback since yesterday's update.
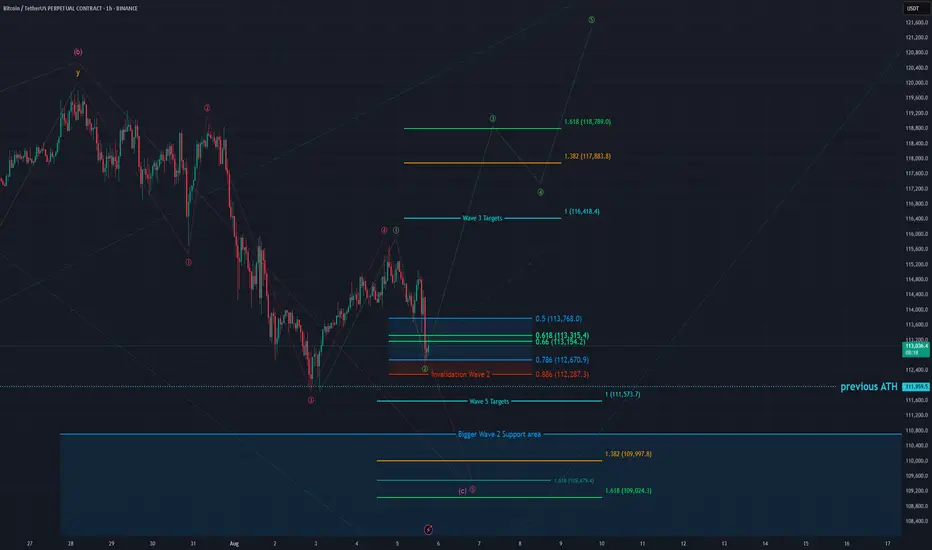
The pullback entered and is currently in our Wave 2 support area which is between the 0.5 FIB at 113'640 USD and the 0.786 FIB at 112'616 USD. The bulls would like to see a bounce now in green Wave 3 of which the targets are the 1 to 1 FIB at 116'418 USD, the 1.382 FIB at 117'883 USD and the 1.618 FIB at 118'789 USD which is also the optimal target for a Wave 3.
Due not invalidating the red Wave 4 we could form the red Wave 5.
Be aware that on the lower timeframes we did touch the 0.886 FIB of a smaller Wave 2 support area which does indicate weakness and usually is followed by another low. If we touch the 0.886 FIB of the Wave 2 support area at 112'287 USD it is also an invalidation of the green bullish count.
Red Wave 5 targets are the 1 to 1 FIB at 111'573 USD which is additionally right below the last low and the last all time high which could function as further support. Further targets would be the 1.382 FIB at 109'997 USD and the 1.618 FIB at 109'024 USD as well as another 1.618 FIB at 109'479 USD.
Be aware that the bigger Wave 2 support area goes down to 103'000 USD.
We think another low is more probable meaning the red count has the higher probability.
Yet we think the green count is a good opportunity as we have a clear set up and invalidation point.
Thanks for reading.
We would appreciate a follow and boost if you like the analysis! :)
NO FINANCIAL ADVICE.
Today we are going to look at the bullish and bearish scenarios so everybody is well prepared for the upcoming price action.
We have seen a pullback since yesterday's update.
The pullback entered and is currently in our Wave 2 support area which is between the 0.5 FIB at 113'640 USD and the 0.786 FIB at 112'616 USD. The bulls would like to see a bounce now in green Wave 3 of which the targets are the 1 to 1 FIB at 116'418 USD, the 1.382 FIB at 117'883 USD and the 1.618 FIB at 118'789 USD which is also the optimal target for a Wave 3.
Due not invalidating the red Wave 4 we could form the red Wave 5.
Be aware that on the lower timeframes we did touch the 0.886 FIB of a smaller Wave 2 support area which does indicate weakness and usually is followed by another low. If we touch the 0.886 FIB of the Wave 2 support area at 112'287 USD it is also an invalidation of the green bullish count.
Red Wave 5 targets are the 1 to 1 FIB at 111'573 USD which is additionally right below the last low and the last all time high which could function as further support. Further targets would be the 1.382 FIB at 109'997 USD and the 1.618 FIB at 109'024 USD as well as another 1.618 FIB at 109'479 USD.
Be aware that the bigger Wave 2 support area goes down to 103'000 USD.
We think another low is more probable meaning the red count has the higher probability.
Yet we think the green count is a good opportunity as we have a clear set up and invalidation point.
Thanks for reading.
We would appreciate a follow and boost if you like the analysis! :)
NO FINANCIAL ADVICE.
Note
Yesterday's Analysis: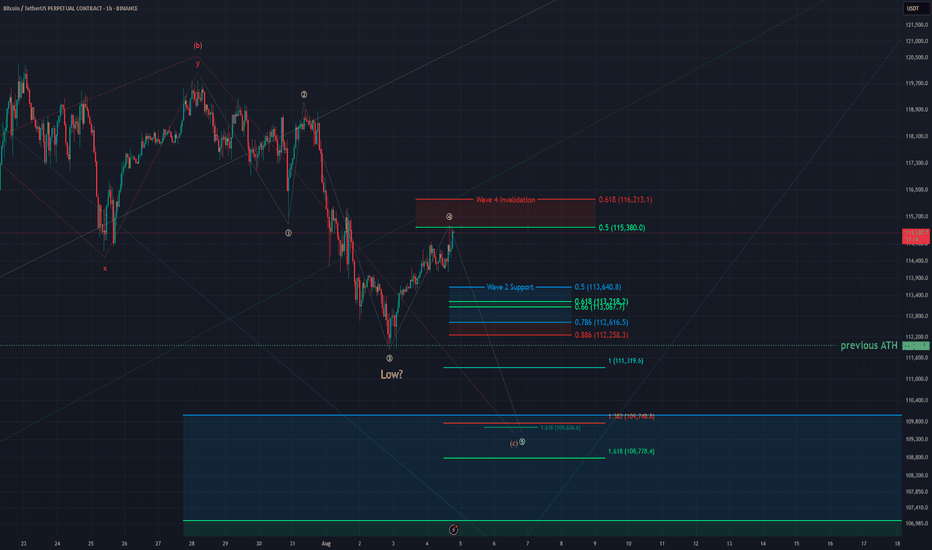
Note
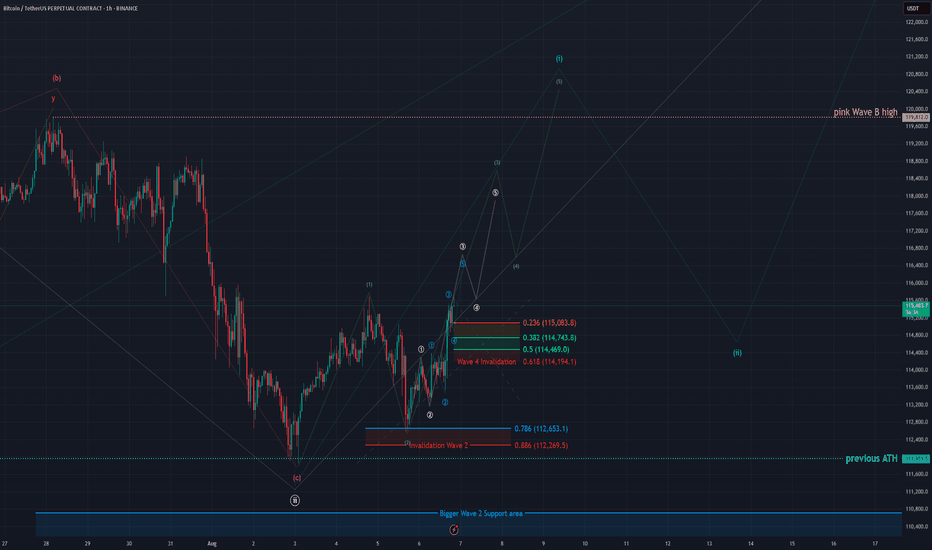
(Next Analysis, somehow tradingview didn't allow me to write it above the image? :D )Note
Disclaimer
The information and publications are not meant to be, and do not constitute, financial, investment, trading, or other types of advice or recommendations supplied or endorsed by TradingView. Read more in the Terms of Use.
Disclaimer
The information and publications are not meant to be, and do not constitute, financial, investment, trading, or other types of advice or recommendations supplied or endorsed by TradingView. Read more in the Terms of Use.