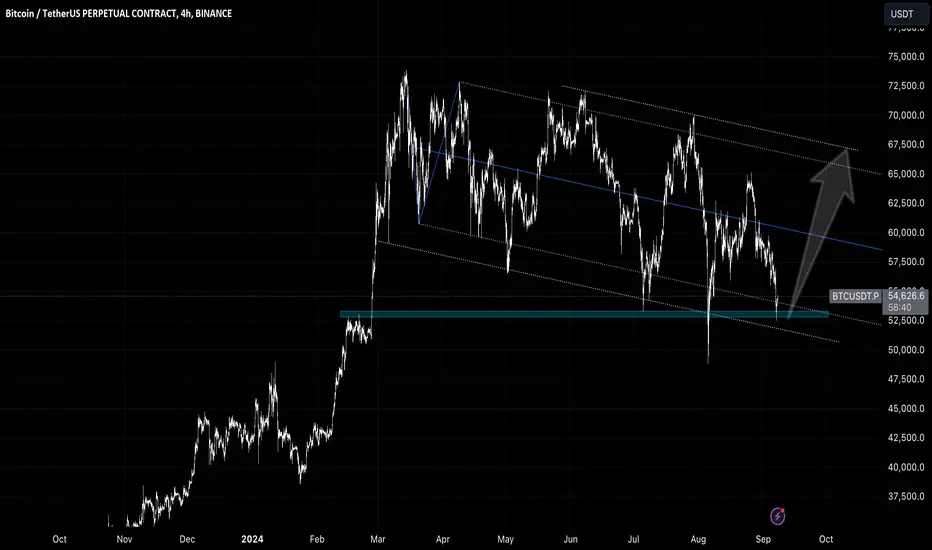
A blue horizontal line represents a possible resistance or support level.
A greenish-blue zone at the bottom indicates a potential strong support area around the $52,500 level.
An arrow pointing upward suggests a potential recovery after hitting the support zone
A greenish-blue zone at the bottom indicates a potential strong support area around the $52,500 level.
An arrow pointing upward suggests a potential recovery after hitting the support zone
Disclaimer
The information and publications are not meant to be, and do not constitute, financial, investment, trading, or other types of advice or recommendations supplied or endorsed by TradingView. Read more in the Terms of Use.
Disclaimer
The information and publications are not meant to be, and do not constitute, financial, investment, trading, or other types of advice or recommendations supplied or endorsed by TradingView. Read more in the Terms of Use.
