Greetings! Another update for you lovely traders :)
Not trying to be confusing, yesterday we looked at the multiple 1-2's set up case, so if you're interested in that count too we recommend you to check out our last analysis which will be linked in the noted down below. Today we will look at the diagonal scenario which we briefly mentioned yesterday!
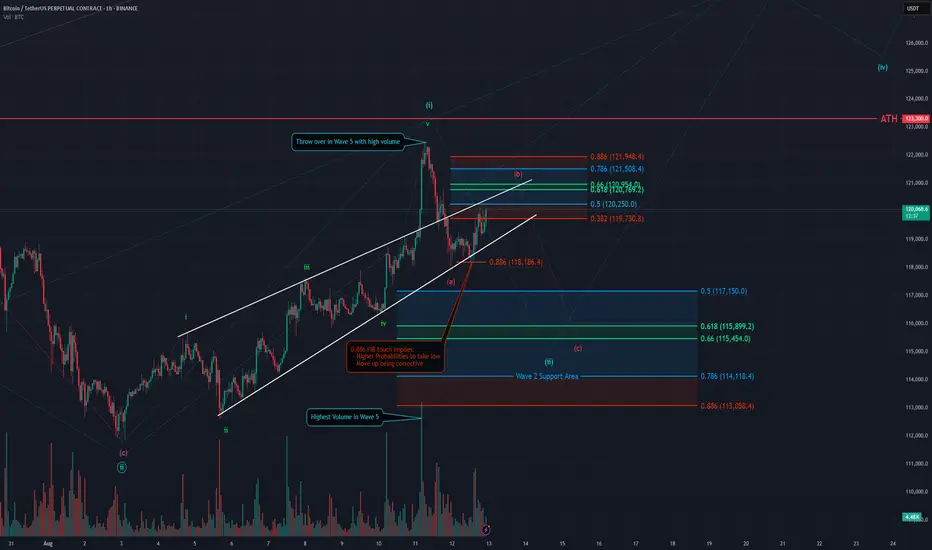
We assume that the recent move up was a diagonal displayed in green as a five wave move up which ended on the green Wave 5 being a throw over, meaning it pushed over the trendline with high volume and it did enter the wedge later on again. This leading diagonal finished the blue Wave 1 and we are looking for blue Wave 2 now which we would like to get after a pullback as red ABC.
The blue Wave 2 support area lies between the 0.5 FIB at 117150 USD and the 0.786 FIB at 114118 USD. We can not calculate targets for the red Wave C yet. The red Wave A seems to have bottomed. In today's bounce we see that we have a 0.886 FIB touch after the red Wave A low which indicates that the next move up is corrective and not impulsive and that the red Wave A low has a higher probability to be taken again.
The red Wave B target area is between the 0.382 FIB at 119730 USD and the 0.886 FIB at 121948 USD. Keep in mind B waves do not have to strictly respect the target area. We could very well get an overshooting B wave that maybe even takes out the ATH, this would be a bullish sign.
Thanks for reading.
NO FINANCIAL ADVICE.
Not trying to be confusing, yesterday we looked at the multiple 1-2's set up case, so if you're interested in that count too we recommend you to check out our last analysis which will be linked in the noted down below. Today we will look at the diagonal scenario which we briefly mentioned yesterday!
We assume that the recent move up was a diagonal displayed in green as a five wave move up which ended on the green Wave 5 being a throw over, meaning it pushed over the trendline with high volume and it did enter the wedge later on again. This leading diagonal finished the blue Wave 1 and we are looking for blue Wave 2 now which we would like to get after a pullback as red ABC.
The blue Wave 2 support area lies between the 0.5 FIB at 117150 USD and the 0.786 FIB at 114118 USD. We can not calculate targets for the red Wave C yet. The red Wave A seems to have bottomed. In today's bounce we see that we have a 0.886 FIB touch after the red Wave A low which indicates that the next move up is corrective and not impulsive and that the red Wave A low has a higher probability to be taken again.
The red Wave B target area is between the 0.382 FIB at 119730 USD and the 0.886 FIB at 121948 USD. Keep in mind B waves do not have to strictly respect the target area. We could very well get an overshooting B wave that maybe even takes out the ATH, this would be a bullish sign.
Thanks for reading.
NO FINANCIAL ADVICE.
Note
Last Analysis: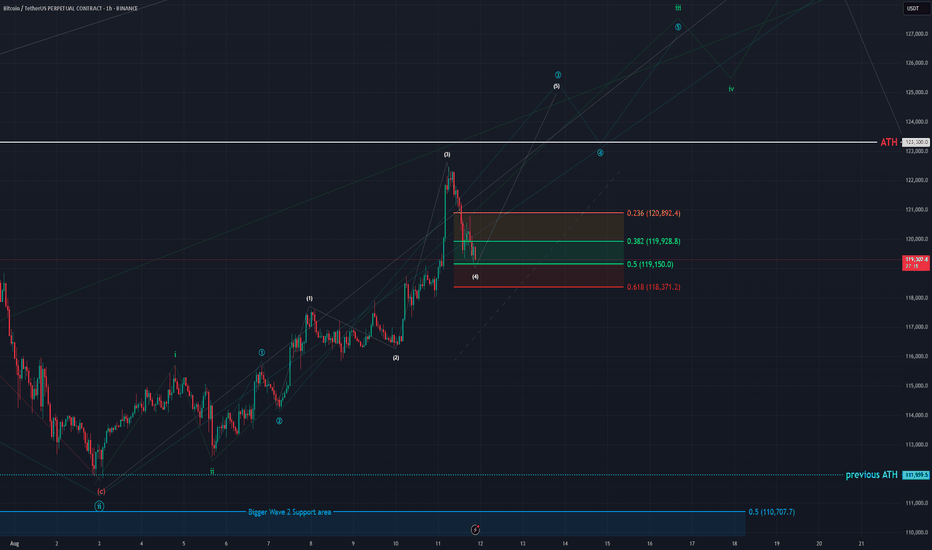
Disclaimer
The information and publications are not meant to be, and do not constitute, financial, investment, trading, or other types of advice or recommendations supplied or endorsed by TradingView. Read more in the Terms of Use.
Disclaimer
The information and publications are not meant to be, and do not constitute, financial, investment, trading, or other types of advice or recommendations supplied or endorsed by TradingView. Read more in the Terms of Use.