This analysis is an update of the analysis you see in the "Related publications" section
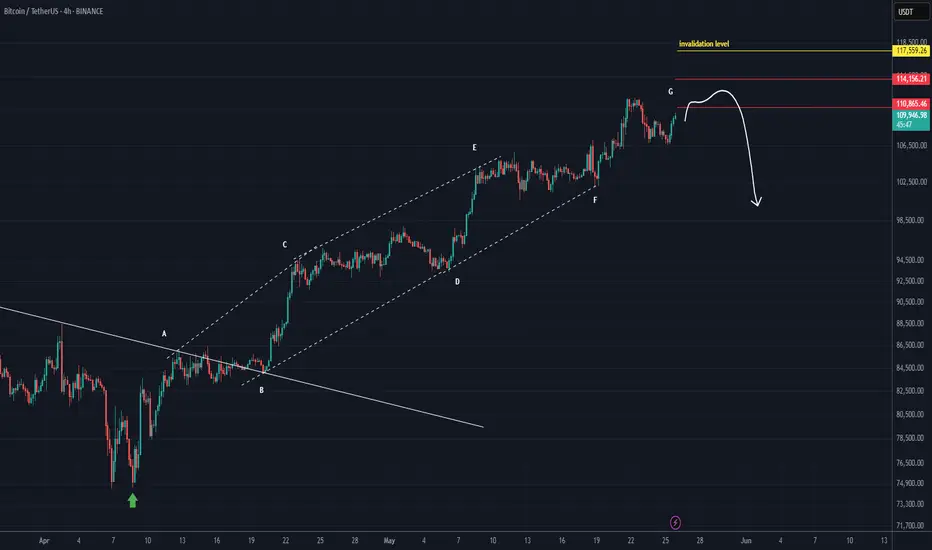
In the previous analysis, we mentioned that you should avoid looking for sell/short positions, as Bitcoin's price pattern was designed to trap short positions. The price followed the direction of the previous yellow arrow as anticipated.
Currently, the major resistance zone for Bitcoin on the chart is the red area. In this zone, a complete bullish pattern could potentially form | or at the very least, one leg of a bullish pattern may be completed.
Let’s see how it plays out.
For risk management, please don't forget stop loss and capital management
Comment if you have any questions
Thank You
🔆To succeed in trading, just enter our Telegram channel:
Free membership: t.me/Behdark_EN
🔷Our Telegram channel has daily spot and futures signals 👉 t.me/Behdark_EN
💎 Exclusive signals are only shared on our Telegram channel
Free membership: t.me/Behdark_EN
🔷Our Telegram channel has daily spot and futures signals 👉 t.me/Behdark_EN
💎 Exclusive signals are only shared on our Telegram channel
Related publications
Disclaimer
The information and publications are not meant to be, and do not constitute, financial, investment, trading, or other types of advice or recommendations supplied or endorsed by TradingView. Read more in the Terms of Use.