💀 Hey , how's it going ? Come over here — Satoshi got something for you !
⏰ We’re analyzing BTC on the 1-hour timeframe timeframe .
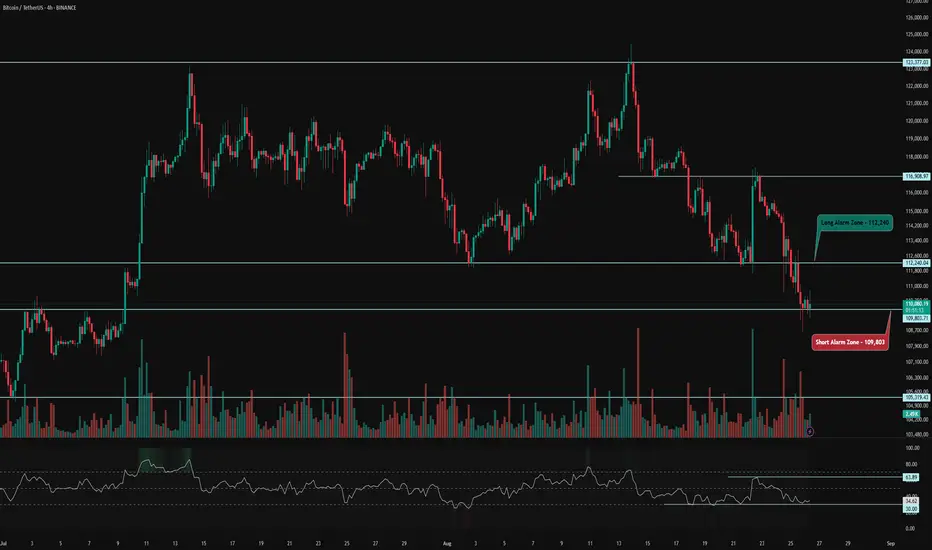
👀 On the 4-hour Bitcoin chart, after hitting a new high, BTC faced a quick rug pull/sell-off with strong momentum toward the $112,000 support. It then bounced with a solid 4-hour candle toward the $117,000 resistance but got heavily rejected again with selling pressure. BTC is now around $110,000, supported once by buyer makers. Today, check Forex Factory for key US economic news that could impact the market.
⚙️ Key RSI level is near 30; crossing this with high volatility could intensify selling pressure, offering a small risk opportunity. Another key level at 64; breaking this could form a higher low compared to the previous one.
🕯 Red candles are increasing in size and volume, with fewer but larger candles moving downward, indicating sustained selling pressure.
💵 On the 1-hour USDT.D chart, after breaking 4.44%, it’s moving upward but showing trend weakness. This level is key for BTC’s highs and lows. A rejection and drop in dominance could boost BTC and BTC pairs, while a hold above 4.44% could deepen BTC’s correction.

🔔 Trading alarm zones are at $112,240 and $109,800. A break and hold above/below these could offer trade setups. Always check oscillator conditions and Tether dominance. Also, focus on BTC pairs — they provide more momentum with less capital.
❤️ Disclaimer : This analysis is purely based on my personal opinion and I only trade if the stated triggers are activated .
⏰ We’re analyzing BTC on the 1-hour timeframe timeframe .
👀 On the 4-hour Bitcoin chart, after hitting a new high, BTC faced a quick rug pull/sell-off with strong momentum toward the $112,000 support. It then bounced with a solid 4-hour candle toward the $117,000 resistance but got heavily rejected again with selling pressure. BTC is now around $110,000, supported once by buyer makers. Today, check Forex Factory for key US economic news that could impact the market.
⚙️ Key RSI level is near 30; crossing this with high volatility could intensify selling pressure, offering a small risk opportunity. Another key level at 64; breaking this could form a higher low compared to the previous one.
🕯 Red candles are increasing in size and volume, with fewer but larger candles moving downward, indicating sustained selling pressure.
💵 On the 1-hour USDT.D chart, after breaking 4.44%, it’s moving upward but showing trend weakness. This level is key for BTC’s highs and lows. A rejection and drop in dominance could boost BTC and BTC pairs, while a hold above 4.44% could deepen BTC’s correction.
🔔 Trading alarm zones are at $112,240 and $109,800. A break and hold above/below these could offer trade setups. Always check oscillator conditions and Tether dominance. Also, focus on BTC pairs — they provide more momentum with less capital.
❤️ Disclaimer : This analysis is purely based on my personal opinion and I only trade if the stated triggers are activated .
join our Telegram channel for more insightful and educational content .
t.me/satoshiframe
t.me/satoshiframe
Related publications
Disclaimer
The information and publications are not meant to be, and do not constitute, financial, investment, trading, or other types of advice or recommendations supplied or endorsed by TradingView. Read more in the Terms of Use.