💀 Hey , how's it going ? Come over here — Satoshi got something for you !
⏰ We’re analyzing BTC on the 4-hour timeframe timeframe .
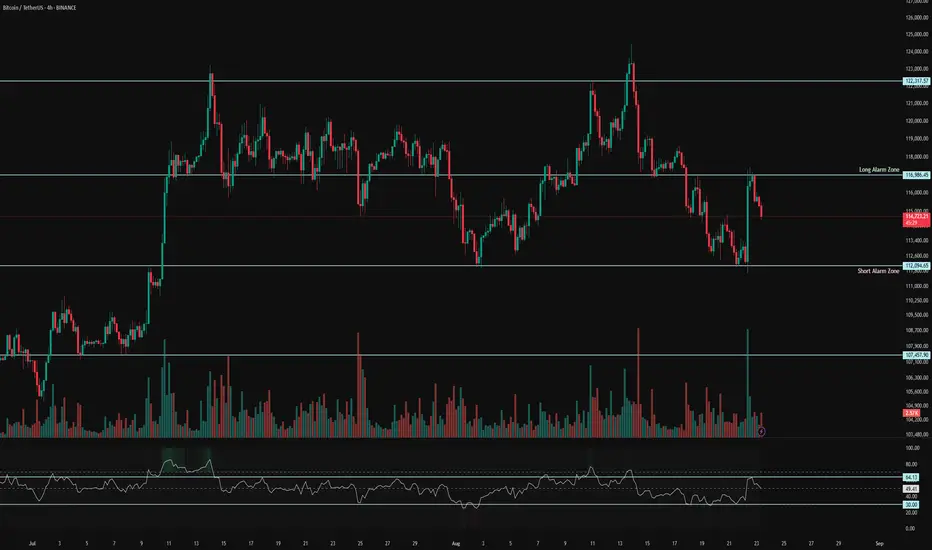
👀 On the 4-hour timeframe, Bitcoin is moving inside a 4H range box. The top of this box is at the $122,300 level and the bottom is at the $112,000 level. The midline of the box is around $117,000, and after touching this level the price got rejected downwards .
⚙️ On the RSI, we have two key zones: 30 and 64. When the oscillator crosses these zones, long or short trading volatility increases and the probability of entering overbought or oversold conditions rises .
🕯 On the 4H chart, the size of the buying candles has become noticeably large. After yesterday’s news, the market faced holidays and volume decreased, but with the opening of the new weekly candle, we may see an increase in trading volume. This could bring more volume into long positions .
💵 USDT.D on the 4-hour timeframe has a support at 4.19% and a resistance at 4.35%. Breaking either of these levels could inject significant volume into Bitcoin. Tether selling volume has been relatively strong and faced selling pressure, which could push this drop further .
🔔 Our trading alarm zones are placed at $117,000 and $112,000. Price action around these levels, with the start of the new week, can be strong. Selling pressure on Tether and a potential interest rate cut may shift the market sentiment toward long positions .
❤️ Disclaimer : This analysis is purely based on my personal opinion and I only trade if the stated triggers are activated .
⏰ We’re analyzing BTC on the 4-hour timeframe timeframe .
👀 On the 4-hour timeframe, Bitcoin is moving inside a 4H range box. The top of this box is at the $122,300 level and the bottom is at the $112,000 level. The midline of the box is around $117,000, and after touching this level the price got rejected downwards .
⚙️ On the RSI, we have two key zones: 30 and 64. When the oscillator crosses these zones, long or short trading volatility increases and the probability of entering overbought or oversold conditions rises .
🕯 On the 4H chart, the size of the buying candles has become noticeably large. After yesterday’s news, the market faced holidays and volume decreased, but with the opening of the new weekly candle, we may see an increase in trading volume. This could bring more volume into long positions .
💵 USDT.D on the 4-hour timeframe has a support at 4.19% and a resistance at 4.35%. Breaking either of these levels could inject significant volume into Bitcoin. Tether selling volume has been relatively strong and faced selling pressure, which could push this drop further .
🔔 Our trading alarm zones are placed at $117,000 and $112,000. Price action around these levels, with the start of the new week, can be strong. Selling pressure on Tether and a potential interest rate cut may shift the market sentiment toward long positions .
❤️ Disclaimer : This analysis is purely based on my personal opinion and I only trade if the stated triggers are activated .
join our Telegram channel for more insightful and educational content .
t.me/satoshiframe
t.me/satoshiframe
Related publications
Disclaimer
The information and publications are not meant to be, and do not constitute, financial, investment, trading, or other types of advice or recommendations supplied or endorsed by TradingView. Read more in the Terms of Use.