BTC/USDT
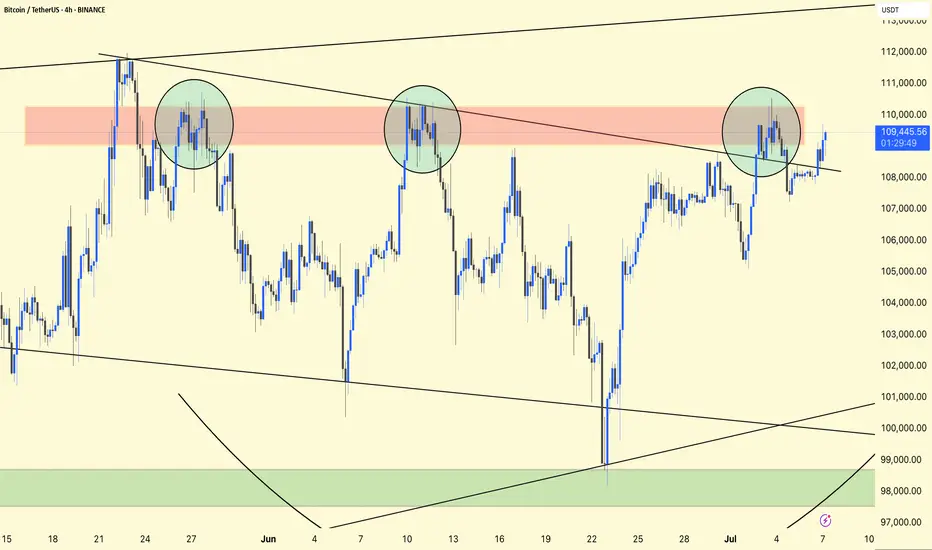
You have three circles highlighting repeated price rejections around the $109,000–$110,000 area (red resistance band).
A descending trendline connects those high points, creating a sloping resistance.
There is a broad support area around $98,000–$100,000 (green area below).
The price recently broke above the trendline and is now retesting around that $109,000–$110,000 area.
If BTC stays above ~$108,500–$109,000, it could head further towards $112,000–$113,000.
A drop below the trendline and back to $107,500 could trap the bulls, leading to a retest of $105,000 or lower support around $100,000.
Bullish setup: Entry $108,800–$109,200, target $112,000–$113,000, stop-loss below $107,000.
Bearish setup: Short if price rejects $109,500–$110,000, target $105,500, stop-loss above $110,800.
Stay alert!
Related publications
Disclaimer
The information and publications are not meant to be, and do not constitute, financial, investment, trading, or other types of advice or recommendations supplied or endorsed by TradingView. Read more in the Terms of Use.
Related publications
Disclaimer
The information and publications are not meant to be, and do not constitute, financial, investment, trading, or other types of advice or recommendations supplied or endorsed by TradingView. Read more in the Terms of Use.