🔍 Key Highlights from the Chart
🟢 Bull Market Peaks
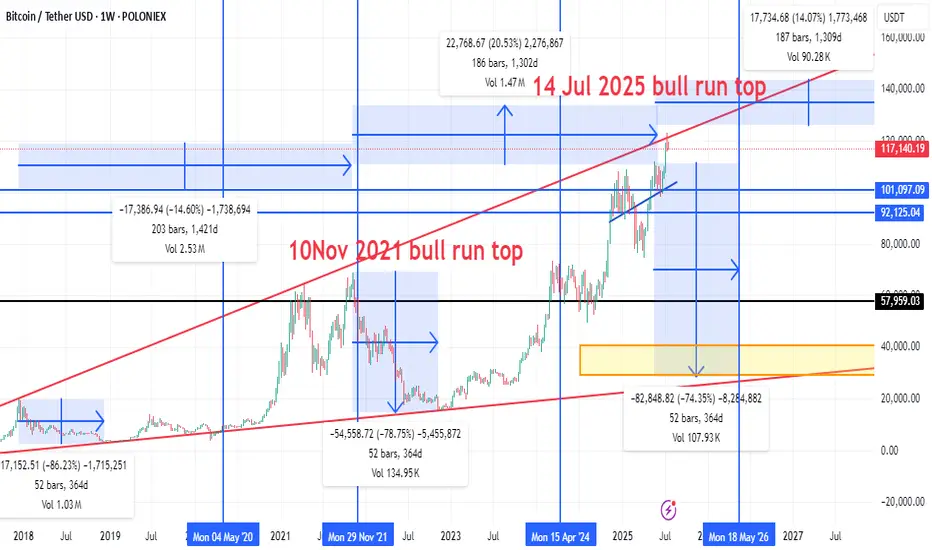
10 Nov 2021: Previous cycle top around ~$69,000.
14 Jul 2025 (Projected): Potential new bull market top (approx. $120K–$125K zone based on red trend line projection).
🔴 Bear Market Drops
2021–2022 Crash:
Drop of -78.75% from the 2021 top.
Lasted 52 bars (364 days).
Next Projected Bear Market:
Projected from July 2025 to May 2026.
Expected drawdown: -74.35%, possibly taking BTC down to the $30K–$40K range (orange box support zone).
📉 Correction Zones
Mid-cycle corrections like the one from Apr 2024, showing smaller drops (~20%).
📈 Trend Channel
Red diagonal lines form an ascending channel for bull market tops.
Current price (~$117,872) is nearing upper resistance of this long-term trend channel.
📊 Support/Resistance Levels
$120K & $125K: Horizontal resistance zones.
$57,959: Major historical support (former resistance).
$30K–$40K: Bear market bottom zone based on history and trendline confluence.
⏳ Cycle Timing
Historical cycles span about 4 years:
Peak → bottom → new peak = ~1,300–1,400 days.
This cycle’s timing aligns almost perfectly:
Nov 2021 → Jul 2025 = 1,300+ days (same as past cycles).
Suggests potential top is in or near.
📌 Summary & Outlook
Phase Estimate
Current Price ~$117,872
Projected Top ~$120K–$125K (likely topped 14 Jul 2025)
Next Major Drop -70% to -75% (target: $30K–$40K)
Next Cycle Low Mid 2026 (May–July 2026)
Strong Support Zone $30K–$40K (orange box)
🧭 Strategic Notes
If this chart pattern holds, major profit-taking should already be done or initiated.
Watch for weekly close rejections at trend channel top for confirmation of top formation.
Reentry in mid-2026 would historically offer a high reward/risk zone.
🟢 Bull Market Peaks
10 Nov 2021: Previous cycle top around ~$69,000.
14 Jul 2025 (Projected): Potential new bull market top (approx. $120K–$125K zone based on red trend line projection).
🔴 Bear Market Drops
2021–2022 Crash:
Drop of -78.75% from the 2021 top.
Lasted 52 bars (364 days).
Next Projected Bear Market:
Projected from July 2025 to May 2026.
Expected drawdown: -74.35%, possibly taking BTC down to the $30K–$40K range (orange box support zone).
📉 Correction Zones
Mid-cycle corrections like the one from Apr 2024, showing smaller drops (~20%).
📈 Trend Channel
Red diagonal lines form an ascending channel for bull market tops.
Current price (~$117,872) is nearing upper resistance of this long-term trend channel.
📊 Support/Resistance Levels
$120K & $125K: Horizontal resistance zones.
$57,959: Major historical support (former resistance).
$30K–$40K: Bear market bottom zone based on history and trendline confluence.
⏳ Cycle Timing
Historical cycles span about 4 years:
Peak → bottom → new peak = ~1,300–1,400 days.
This cycle’s timing aligns almost perfectly:
Nov 2021 → Jul 2025 = 1,300+ days (same as past cycles).
Suggests potential top is in or near.
📌 Summary & Outlook
Phase Estimate
Current Price ~$117,872
Projected Top ~$120K–$125K (likely topped 14 Jul 2025)
Next Major Drop -70% to -75% (target: $30K–$40K)
Next Cycle Low Mid 2026 (May–July 2026)
Strong Support Zone $30K–$40K (orange box)
🧭 Strategic Notes
If this chart pattern holds, major profit-taking should already be done or initiated.
Watch for weekly close rejections at trend channel top for confirmation of top formation.
Reentry in mid-2026 would historically offer a high reward/risk zone.
Disclaimer
The information and publications are not meant to be, and do not constitute, financial, investment, trading, or other types of advice or recommendations supplied or endorsed by TradingView. Read more in the Terms of Use.
Disclaimer
The information and publications are not meant to be, and do not constitute, financial, investment, trading, or other types of advice or recommendations supplied or endorsed by TradingView. Read more in the Terms of Use.