Trade Setup Analysis
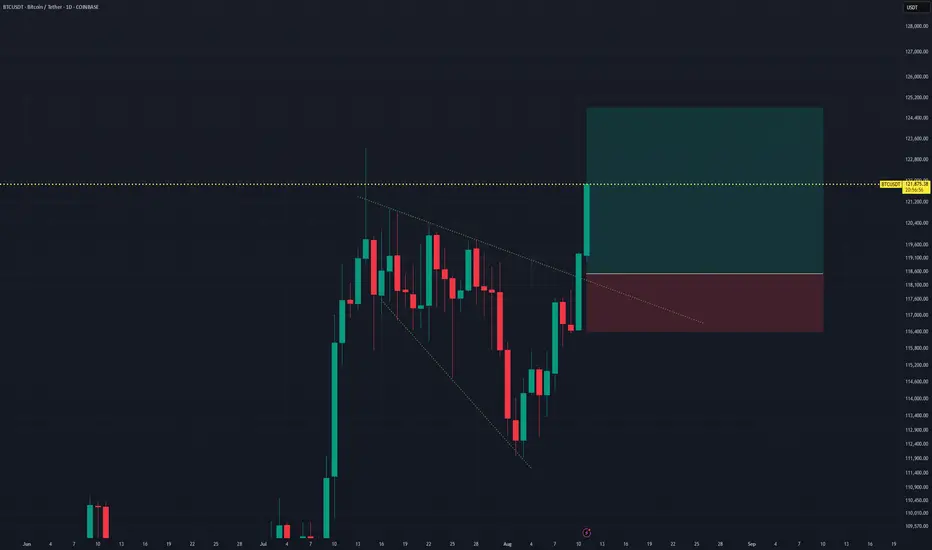
- Timeframe: Daily (D1)
- Position Type: Long (Buy)
Entry Point: 118,530.49
Positioned immediately after a breakout from a descending triangle pattern, aiming to catch early bullish momentum.
Stop Loss (SL): 116,429.15
Placed below recent swing lows and under the lower trendline of the triangle. A break below this level would invalidate the bullish breakout thesis. Risk exposure is approximately -1.77% from entry.
Take Profit (TP): 124,868.05
Target set at a key resistance zone, offering a potential upside of around +5.30% from entry.
Risk/Reward Ratio: 2.99
A strong setup with nearly three times the reward compared to the risk, suitable for short-term swing trading.
Technical Outlook:
BTCUSDT has broken out of a descending triangle formation with a strong bullish candle, indicating possible continuation. The entry at 118,530 positions the trade close to the breakout point, maximizing profit potential if momentum holds.
Bullish Scenario: Sustained price action above 118,530 could lead to a rally toward the 124,868 target.
Bearish Invalidation: A breakdown below 116,429 would invalidate the bullish setup, potentially resuming the prior downtrend.
Summary:
This trade captures a breakout confirmation with a well-placed stop below structural support and a target aligned with the next resistance level. Monitoring for follow-through buying pressure is key to validating the trade.
Trade active
+3% (MOVE SL TO BREAKEVEN)Trade closed: target reached
+5% Close EarlyDisclaimer
The information and publications are not meant to be, and do not constitute, financial, investment, trading, or other types of advice or recommendations supplied or endorsed by TradingView. Read more in the Terms of Use.
Disclaimer
The information and publications are not meant to be, and do not constitute, financial, investment, trading, or other types of advice or recommendations supplied or endorsed by TradingView. Read more in the Terms of Use.