It doesn't stop... I need a break.
I was hoping the consolidation took a few days at least but not the way it going at the moment.
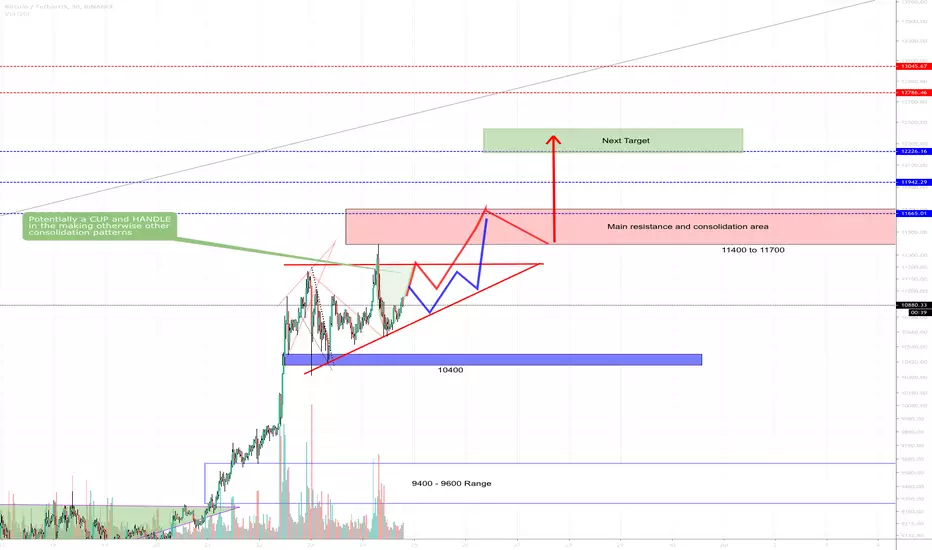
***Please refer to the previous posts for references to the targets such as 11400 etc regarding this one***
Here are my thoughts\theory for now, what looks like another bullish pattern.
The main point, we are not going to have a massive pullback, only a drop from the top of 6.7%. We have already recovered nearly 3% of it.
If you look at the chart, the main lines are abiding fib. fan and fib levels and hence I think we have enough data to make a BIG assumption as to what is taking form/pattern.
As per my charts, 11,400 to 11,700 Range is a tough resistance.
It can potentially turn into any pattern, but for now, I have a ascending triangle.
As for many big shapes, they can turn into a Pennant or Wedge, but will likely be a BULLISH pattern.
We can only know the true form as more (time) information comes through.
I also see a potential CUP and HANDLE or just CUP shape forming in the 1 HRLY chart. Previous shape was a BIG W.
As for the timeframes of other charts, eg. The 1 HRLY and 4 HRLY chart all look bullish, WHY. WE have lower highs.
The DAILY chart is definitely bullish.
30 Min Chart:

4 HRLY Chart:

High overview Chart:

Click "LIKE" if you like or appreciate the posting.
Cheers.
SS/Cryptoprospa
I was hoping the consolidation took a few days at least but not the way it going at the moment.
***Please refer to the previous posts for references to the targets such as 11400 etc regarding this one***
Here are my thoughts\theory for now, what looks like another bullish pattern.
The main point, we are not going to have a massive pullback, only a drop from the top of 6.7%. We have already recovered nearly 3% of it.
If you look at the chart, the main lines are abiding fib. fan and fib levels and hence I think we have enough data to make a BIG assumption as to what is taking form/pattern.
As per my charts, 11,400 to 11,700 Range is a tough resistance.
It can potentially turn into any pattern, but for now, I have a ascending triangle.
As for many big shapes, they can turn into a Pennant or Wedge, but will likely be a BULLISH pattern.
We can only know the true form as more (time) information comes through.
I also see a potential CUP and HANDLE or just CUP shape forming in the 1 HRLY chart. Previous shape was a BIG W.
As for the timeframes of other charts, eg. The 1 HRLY and 4 HRLY chart all look bullish, WHY. WE have lower highs.
The DAILY chart is definitely bullish.
30 Min Chart:
4 HRLY Chart:
High overview Chart:
Click "LIKE" if you like or appreciate the posting.
Cheers.
SS/Cryptoprospa
Note
CUP and HANDLE formation is now ruled out and a sloppy nether the less an ASCENDING TRIANGLE (BULLISH) is most likely now. The 11500 to 11700 range would be tough to break. My guess at this time, a 11500 first knock will occur and depending on the run up (momentum) will determine to sell in this range, if its required.
To get past the 11700 zone, for further upsides, we will need to see a opening and closing of a 4 hrly candle above this high resistance zone. Then 12800 or so will be the target.
Looking at the below RSI charts, we have room for further upside and RSIs are looking good/bullish.
4 HRLY RSI Chart:
DAILY RSI Chart:
Note
Note
Reevaluated my price range (on Binance) and now the range is between 11480 to 11,600 (as the first Target) and a somewhat pullback to a strong support line, potentially in the making (where it finds resistance on the way up), otherwise the standard 0.618, 0.786 or 55 EMA.Note
Current progress...on the 4 HRLY chart.Note
Seems to be consolidating for another attempt above 11400,Note
Known as a CUP and Handle formation, its height\target is equal to the depth of the cup. Not the best of cups but just maybe, only after can we confirm. What are your thoughts?Note
Like to thank Alexander for a great pickup which gave me confidence in my forecast as well.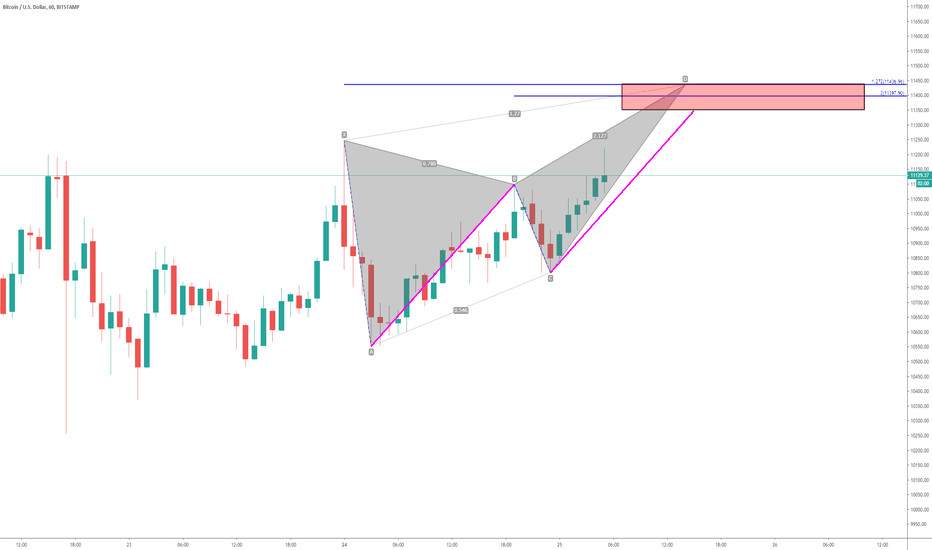
Note
Note
Target reached, Next short term target, back to 11400.I don't see it dropping much more than this as its a crazzy bull market and the FOMO is too high. If it does drop, it will be around 11,200 range and back up.
Trade closed: target reached
Note
Discord: discord.com/invite/vb4hbP88vb (TradeToProspa)
Telegram: t.me/TprospaTradersbot
This community has signals now but with no risk management comms.
Telegram: t.me/TprospaTradersbot
This community has signals now but with no risk management comms.
Related publications
Disclaimer
The information and publications are not meant to be, and do not constitute, financial, investment, trading, or other types of advice or recommendations supplied or endorsed by TradingView. Read more in the Terms of Use.