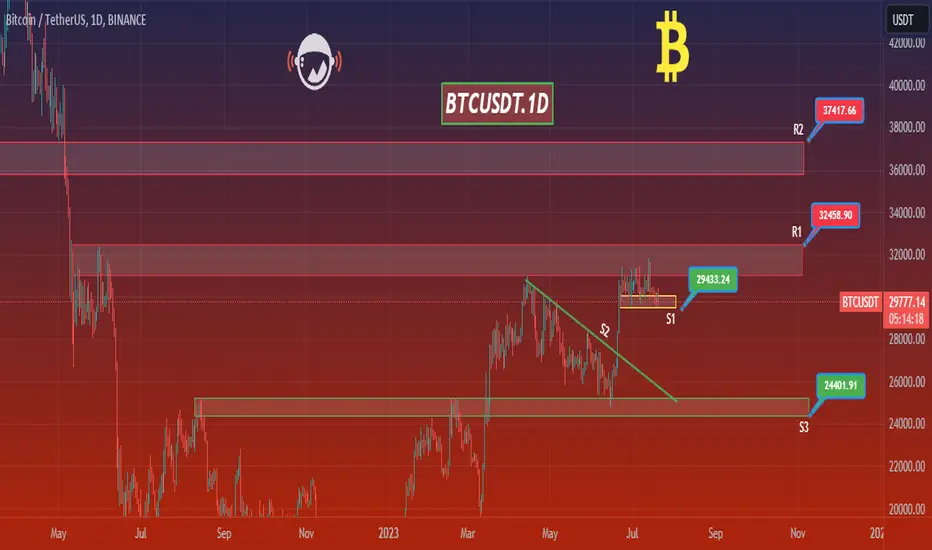
This is a 1D frame analysis for BTCUSDT We first analyze the weekly time frame of the market and then move on to the daily time frame. Currently, with the pressure of selling on the first resistance area and the weekly candle closing, we can consider a star follow-up candle that can give us a corrective market rise at the resistance level. However, until the price is above the yellow support line, we are in a state of flux, and you dear companions know that technical analysis can never see everything and other events can change the market trend. We first analyze the weekly time frame of the market and then move on to the daily time frame. Currently, with the pressure of selling on the first resistance area and the weekly candle closing, we can consider a star follow-up candle that can give us a corrective market rise at the resistance level. However, until the price is above the yellow support line, we are in a state of flux, and you dear companions know that technical analysis can never see everything and other events can change the market trend.
Disclaimer
The information and publications are not meant to be, and do not constitute, financial, investment, trading, or other types of advice or recommendations supplied or endorsed by TradingView. Read more in the Terms of Use.
Disclaimer
The information and publications are not meant to be, and do not constitute, financial, investment, trading, or other types of advice or recommendations supplied or endorsed by TradingView. Read more in the Terms of Use.