Technical Breakdown
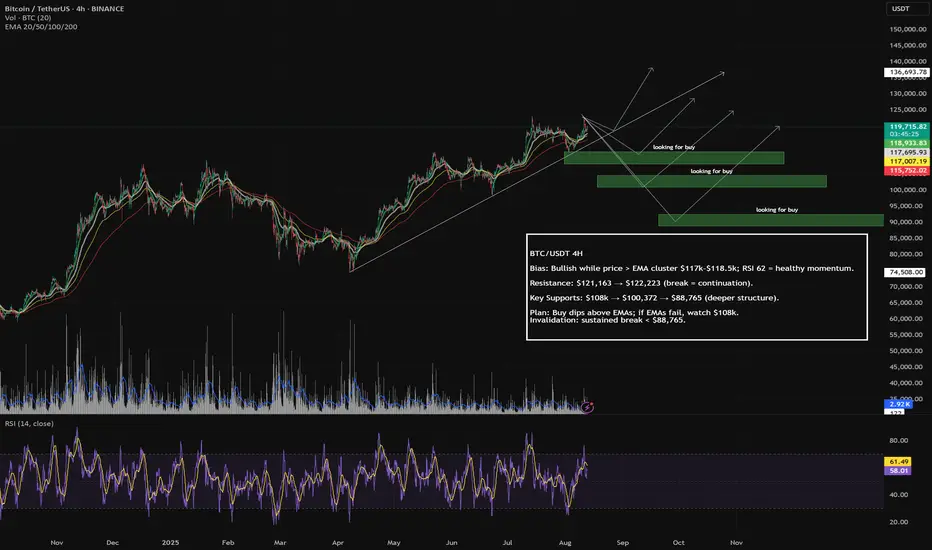
Trend & Price Action: The overall trend remains bullish. The price is currently holding strong above the primary EMA cluster after a significant run-up, indicating buyer control.
Immediate Dynamic Support: The cluster of EMAs around $117,000 - $118,500 serves as the most immediate, dynamic support zone. The price holding above this area is critical for short-term bullish momentum.
RSI: The RSI at 62.15 confirms healthy bullish momentum with room to move higher before reaching overbought conditions.
Key Levels to Watch
Horizontal Support Zones:
These levels are critical as they represent previous areas of resistance and consolidation that have now likely flipped to support.
Support 1: ~$110,000: This level acted as a ceiling in late June and is the first major horizontal support to watch during a pullback.
Support 2: ~$100,372: This was a key consolidation zone in early June.
Support 3: ~$88,765: This is a major structural level, acting as a peak in April and providing support in late May. It represents the most significant of the three drawn support lines.
Resistance:
The upside targets remain the recent highs, identified by the indicator as:
$121,163
$122,223
Potential Scenarios
Bullish Continuation: The price remains above the EMA cluster and pushes through the $122,223 resistance. This would signal a strong continuation of the uptrend.
Corrective Pullback: If the price breaks down through the immediate EMA support, the market will look for a reaction at the key horizontal levels.
A minor correction would find support near $108,000.
A deeper correction would target $100,372, and in a major bearish shift, the crucial support at $88,765 would be the last line of defense for the current market structure.
Conclusion: The short-term outlook is bullish while the price stays above the EMAs. However, the support lines at $108k, $100k, and $88k are the most important levels to watch to gauge the severity of any potential pullback and the overall health of the uptrend.
Note
While the faster EMAs have failed, the price is currently finding tentative support on the long-term 200 EMA. This is now the last line of dynamic support before our major horizontal levels. A decisive break below the 200 EMA would strengthen the case for a drop to the ~$108,000 support zone.Disclaimer
The information and publications are not meant to be, and do not constitute, financial, investment, trading, or other types of advice or recommendations supplied or endorsed by TradingView. Read more in the Terms of Use.
Disclaimer
The information and publications are not meant to be, and do not constitute, financial, investment, trading, or other types of advice or recommendations supplied or endorsed by TradingView. Read more in the Terms of Use.