This is my last attempt at predicting the top of this upwards move on the HTF.
Adjusting these trendlines to where BTC pumped to, which was a lot higher than initially anticipated, it does look to me that these trendlines are still respected.
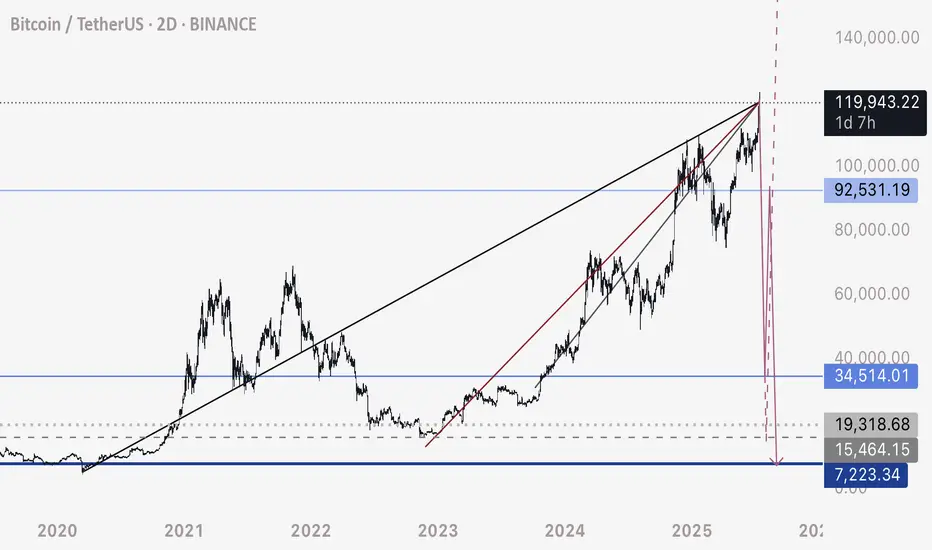
There are 3 bearish ascending lines that price has been interacting with - I assume we are looking at a crossing intersection of them, per the chart here.
If BTC continues higher without a very fast, drastic free fall - I will be looking at other possibilities. If price moves above 122,000 again, I would consider this invalid - as I suspect the resistance level sits around 120,000 to 120,500 area.
I will be looking for a very fast drop to consider this possibility as valid and likely from here on.
Adjusting these trendlines to where BTC pumped to, which was a lot higher than initially anticipated, it does look to me that these trendlines are still respected.
There are 3 bearish ascending lines that price has been interacting with - I assume we are looking at a crossing intersection of them, per the chart here.
If BTC continues higher without a very fast, drastic free fall - I will be looking at other possibilities. If price moves above 122,000 again, I would consider this invalid - as I suspect the resistance level sits around 120,000 to 120,500 area.
I will be looking for a very fast drop to consider this possibility as valid and likely from here on.
Disclaimer
The information and publications are not meant to be, and do not constitute, financial, investment, trading, or other types of advice or recommendations supplied or endorsed by TradingView. Read more in the Terms of Use.
Disclaimer
The information and publications are not meant to be, and do not constitute, financial, investment, trading, or other types of advice or recommendations supplied or endorsed by TradingView. Read more in the Terms of Use.