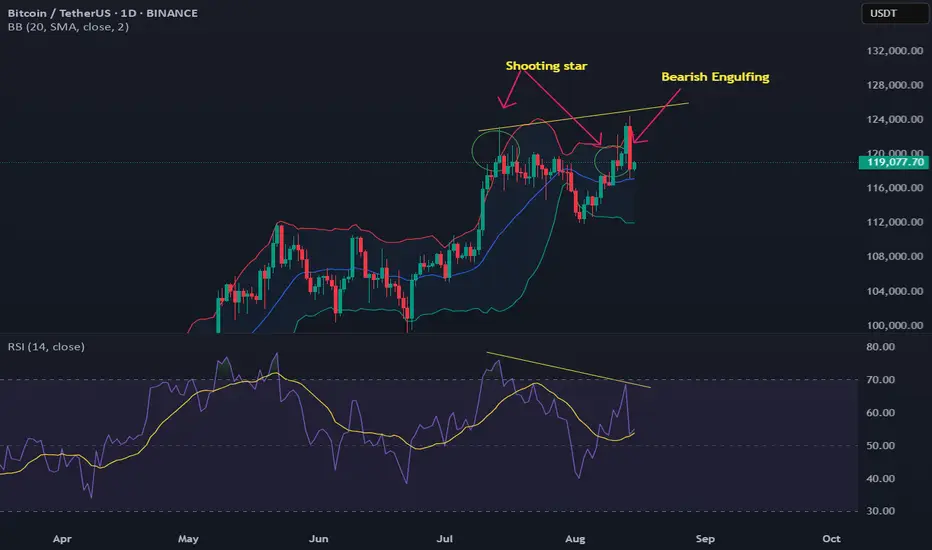
Bitcoin Bearish Technical Setup (Daily Chart):
📉 Upper Bollinger Band Touched
→ Signals potential overbought conditions and resistance near current price levels.
🌑 Two Consecutive Shooting Star Candlesticks
→ Indicates strong rejection from the highs and potential exhaustion of bullish momentum.
🔻 Bearish Engulfing Candle
→ Confirms sellers are gaining control; often marks the start of a downtrend.
📉 RSI Bearish Divergence
→ Price made higher highs while RSI made lower highs — a classic signal of weakening bullish momentum and possible reversal.
Disclaimer
The information and publications are not meant to be, and do not constitute, financial, investment, trading, or other types of advice or recommendations supplied or endorsed by TradingView. Read more in the Terms of Use.
Disclaimer
The information and publications are not meant to be, and do not constitute, financial, investment, trading, or other types of advice or recommendations supplied or endorsed by TradingView. Read more in the Terms of Use.