🔍 Original Interpretation:
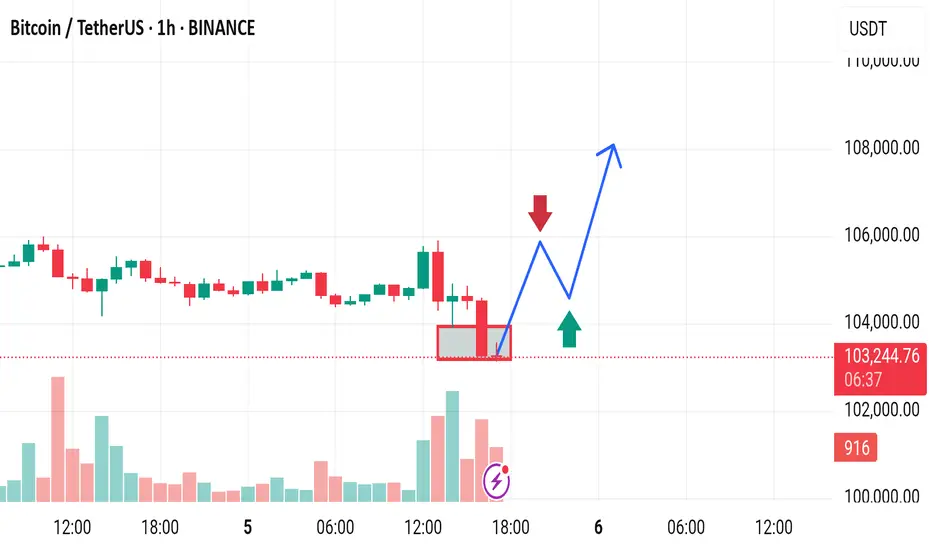
Support Zone: The red rectangle suggests a support level between ~102,800 and ~103,300.
Bullish Bias: The blue arrow anticipates a bounce from this zone, potentially forming a higher low before continuing upward.
Bearish Bias: The red arrow marks a potential resistance, predicting rejection and a move lower if the bullish breakout fails.
---
⚠️ Disruptive Analysis:
1. False Support Breakout Risk:
A false breakdown beneath the support zone could trigger panic selling before a rapid recovery (fakeout).
Traders might place stop-losses just below the box — a perfect target for market makers before price reverses.
2. Volume Deception:
Volume increased during the sell-off but did not show strong absorption by buyers (green volume wasn't dominant).
This suggests sellers still dominate and a continuation lower could occur before any bounce.
3. Lower Highs Formation:
The last few green candles failed to break the previous highs, indicating weaker buying strength.
Price may form a lower high, hinting at a short-term bearish trend.
4. Macro Trend Consideration:
If this is just a retracement within a larger downtrend, the bounce could be short-lived.
Broader market sentiment or macro news could push BTC toward 100,000 support or lower.
Disclaimer
The information and publications are not meant to be, and do not constitute, financial, investment, trading, or other types of advice or recommendations supplied or endorsed by TradingView. Read more in the Terms of Use.
Disclaimer
The information and publications are not meant to be, and do not constitute, financial, investment, trading, or other types of advice or recommendations supplied or endorsed by TradingView. Read more in the Terms of Use.