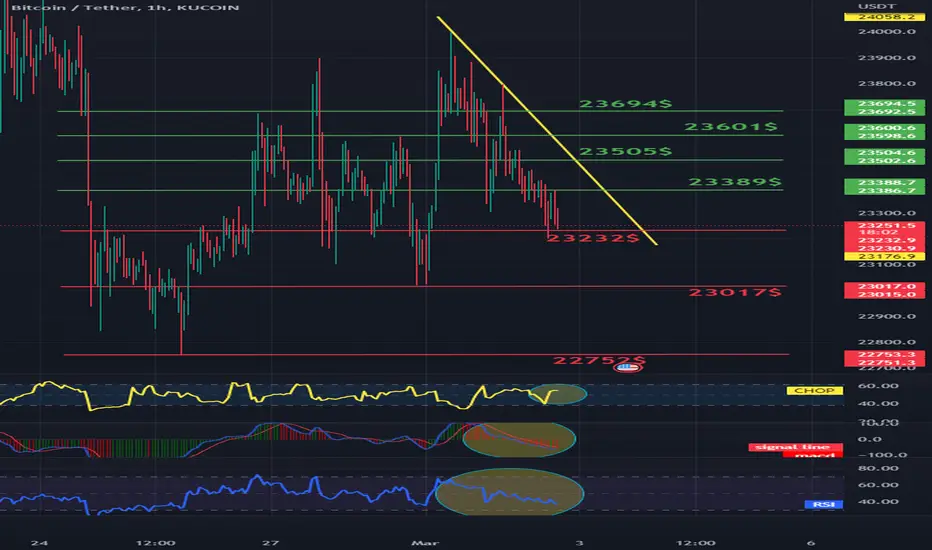
Hello everyone, let's look at the BTC to USDT chart on a 1-hour timeframe. As you can see, the price is moving below the local downtrend line.
Let's start with the support line and as you can see the first support in the near future is $23232, if the support is broken then the next support is $23017 and $22752.
Now let's move to the resistance line, as you can see the first resistance is $23389, if you manage to break it, the next resistance will be $23505, $23601 and $23694.
Looking at the CHOP indicator, we see that there is a lot of energy for movement, the MACD maintains a local downtrend, while the RSI has a strong rebound, which creates room for new increases.
Disclaimer
The information and publications are not meant to be, and do not constitute, financial, investment, trading, or other types of advice or recommendations supplied or endorsed by TradingView. Read more in the Terms of Use.
Disclaimer
The information and publications are not meant to be, and do not constitute, financial, investment, trading, or other types of advice or recommendations supplied or endorsed by TradingView. Read more in the Terms of Use.