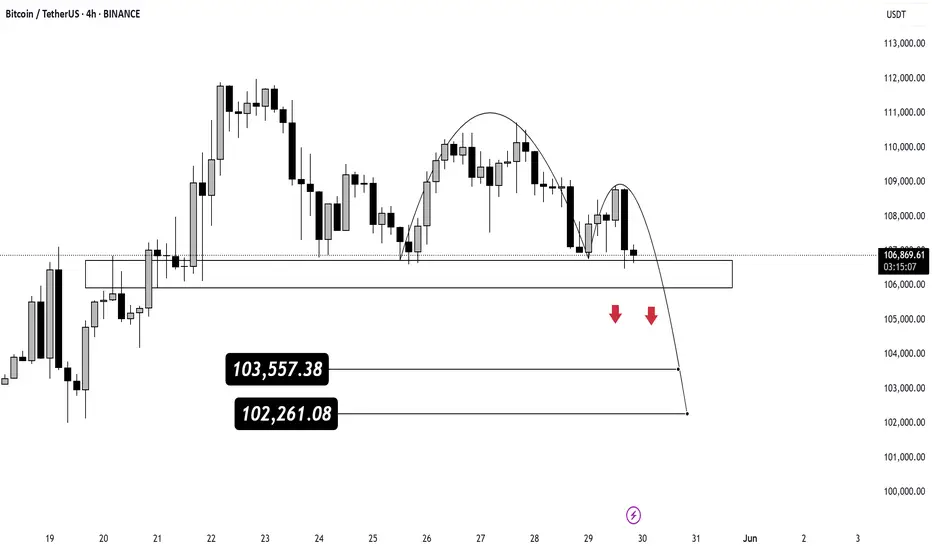
Bitcoin is forming a classic Head & Shoulders pattern on the 4H chart — a sign of potential bearish reversal. Price is currently testing the neckline support zone around $106,800.
🔴 A breakdown below this level could trigger a move toward the next support zones:
📉 Target 1: $103,557
📉 Target 2: $102,261
⚠️ Keep an eye on how BTC reacts around the neckline. A confirmed breakdown with strong volume may lead to short-term downside.
Subscribe to my Telegram Channel 👉 :
t.me/addlist/y5mi70s3c0Y3MDQ0
Subscribe to my X 👉 : x.com/VIPROSETR
t.me/addlist/y5mi70s3c0Y3MDQ0
Subscribe to my X 👉 : x.com/VIPROSETR
Disclaimer
The information and publications are not meant to be, and do not constitute, financial, investment, trading, or other types of advice or recommendations supplied or endorsed by TradingView. Read more in the Terms of Use.