Hello, traders.
If you "Follow", you can always get the latest information quickly.
Have a nice day today.
-------------------------------------
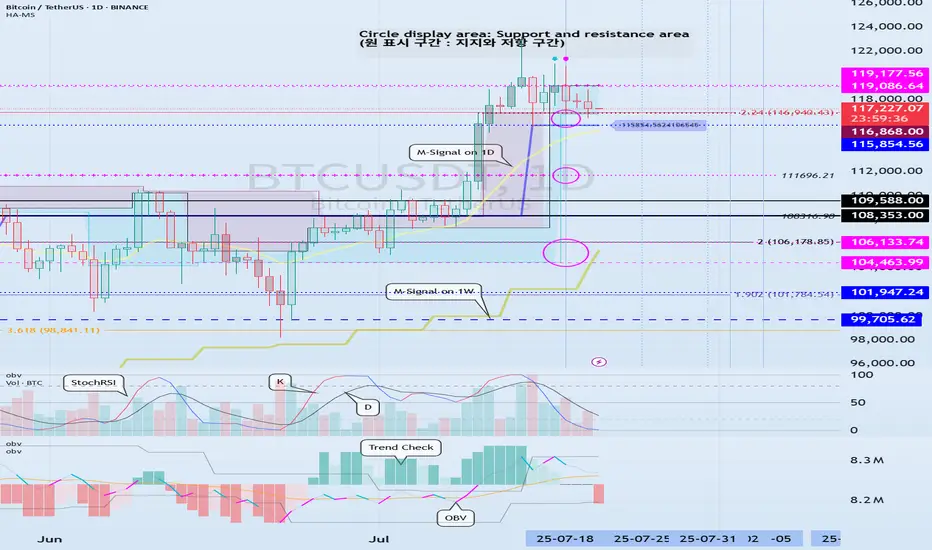
(BTCUSDT 1D chart)
The DOM(60) indicator of the 1W chart is generated at the 119177.56 point, and the DOM(60) indicator of the 1D chart is generated at the 119086.64 point, and then shows a downward trend.
However, since the HA-High indicator is formed at the 115854.56 point, it is difficult to say that it has yet turned into a downward trend.
Accordingly, it is necessary to check whether it is supported in the HA-High ~ DOM(60) section.
The next volatility period is expected to occur around July 25 (July 24-26).
However, the important volatility period is expected to be around August 2-5 (maximum August 1-6), so we need to look at what kind of movement it shows as it passes through the volatility period that will occur in the future.
-
Since the StochRSI indicator has entered the oversold zone, there is a possibility that the decline will be restricted.
Therefore, the key is whether there is support around 115854.56-116868.0.
This is because if it falls below the HA-High indicator, there is a possibility that a downtrend will begin.
Also, since the M-Signal indicator on the 1D chart is rising around 115854.56, it can be seen as an important zone.
--------------------------------------------------
An indicator called Trend Check has been added to the OBV indicator.
This indicator is an indicator that comprehensively evaluates the StochRSI, PVT-MACD oscillator, and OBV indicators and expresses them in a column.
Accordingly, if the TC indicator rises from the 0 point, it can be interpreted that the buying force is dominant, and if it falls, the selling force is dominant.
Therefore, if it rises above 0, it is likely to show an upward trend, and if it falls below 0, it is likely to show a downward trend.
Also, if the TC indicator touches the highest point (6) or lowest point (-6), there is a high possibility that the trend will reverse, so you should think about a response plan for this.
-
Thank you for reading to the end.
I hope you have a successful trade.
--------------------------------------------------
- Here is an explanation of the big picture.
(3-year bull market, 1-year bear market pattern)

I will explain the details again when the bear market starts.
------------------------------------------------------
Note
#BTCUSDTIt is named Trend Check because it identifies the movement of trading volume and interprets it to check what the future trend will be.
Since multiple indicators are made into one indicator, you can use them interchangeably as needed.
If you activate more than two indicators at the same time, you will not be able to check the indicators properly.
Therefore, you can add multiple indicators like my chart and activate them one by one.
You can also use the StochRSI indicator and Trend Check indicator together.
At this time, you should activate TC6 and TC-6 as shown in the figure, so that the 50 point of the StochRSI indicator is set as the 0 point for easier viewing.
Currently, the TC (Trend Check) indicator is showing a downward trend below the 0 point.
-
The fact that it has fallen below the 0 point means that the selling pressure is dominant, and it is likely to show a downward trend.
However, since the HA-High indicator is formed at the 115854.56 point, you need to check whether it is supported around this area.
Therefore, you need to check whether it is supported around 115854.56-116868.0.
Looking at the bigger picture, since it is currently in the HA-High ~ DOM(60) range, you need to think about a response strategy depending on whether it is supported in this range.
If it rises above the DOM(60) indicator, that is, above 119086.64, there is a possibility that it will continue to rise in steps.
On the other hand, if it falls below the HA-High indicator, that is, below 115854.56, there is a possibility that a downtrend will begin.
Therefore, you need to think about a response plan for this.
The next volatility period is around July 25 (July 24-26), so you need to check the movement at that time.
Based on the current movement, we expect to see a close encounter with the M-Signal indicator on the 1D chart around the next volatility period.
Other content (coins, stocks, etc.) is frequently posted on X.
X에 다른 내용(코인, 주식 등)이 자주 게시.
◆ t.me/readCryptoChannel
[HA-MS Indicator]
bit.ly/3YxHgvN
[OBV Indicator]
bit.ly/4dcyny3
X에 다른 내용(코인, 주식 등)이 자주 게시.
◆ t.me/readCryptoChannel
[HA-MS Indicator]
bit.ly/3YxHgvN
[OBV Indicator]
bit.ly/4dcyny3
Related publications
Disclaimer
The information and publications are not meant to be, and do not constitute, financial, investment, trading, or other types of advice or recommendations supplied or endorsed by TradingView. Read more in the Terms of Use.