Hello Guy's Welcome To Another Day Of TRADING
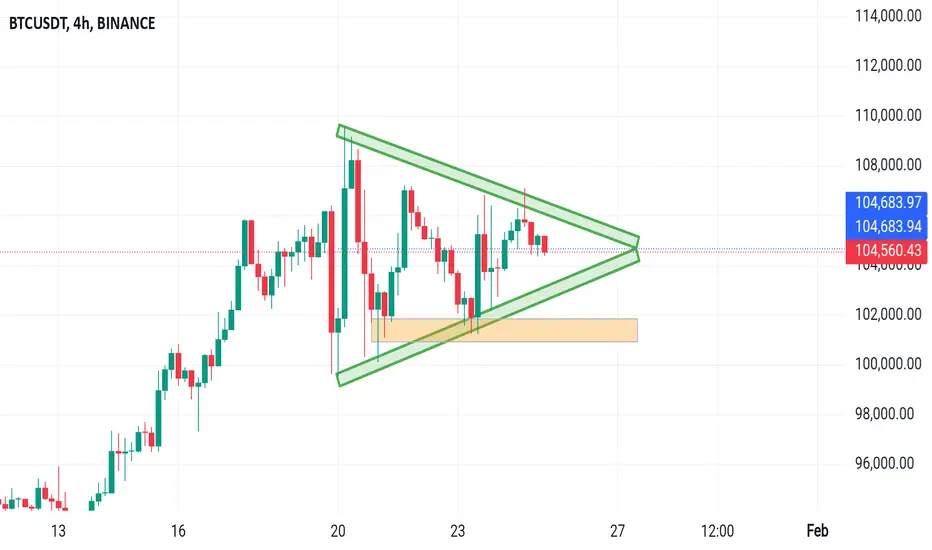
Here we are mapping chart of BTCUSDT ( BITCOIN ) in 4-Hour TF
Our chart shows Bitcoin's price moving within a triangle shape. The price is going up and down, getting squeezed into a smaller range.
What this means: The price is preparing for a big move, either up or down.
If it breaks up: The price might increase a lot.
SUPPORT LEVEL 103,500
2ND SUPPORT. 102,000
TARGET IS 106,500 - 108,000
If the price breaks above resistance, it’s a bullish signal. If it breaks below support, it’s bearish.
If it breaks down: The price might drop, possibly toward the orange zone (2nd support area).
Trade active
BTCUSDT BUY TRADE ACTIVE 1042001ST TARGET. 105100
2ND TARGET. 105810
Disclaimer
The information and publications are not meant to be, and do not constitute, financial, investment, trading, or other types of advice or recommendations supplied or endorsed by TradingView. Read more in the Terms of Use.
Disclaimer
The information and publications are not meant to be, and do not constitute, financial, investment, trading, or other types of advice or recommendations supplied or endorsed by TradingView. Read more in the Terms of Use.