🔸 Market Structure:
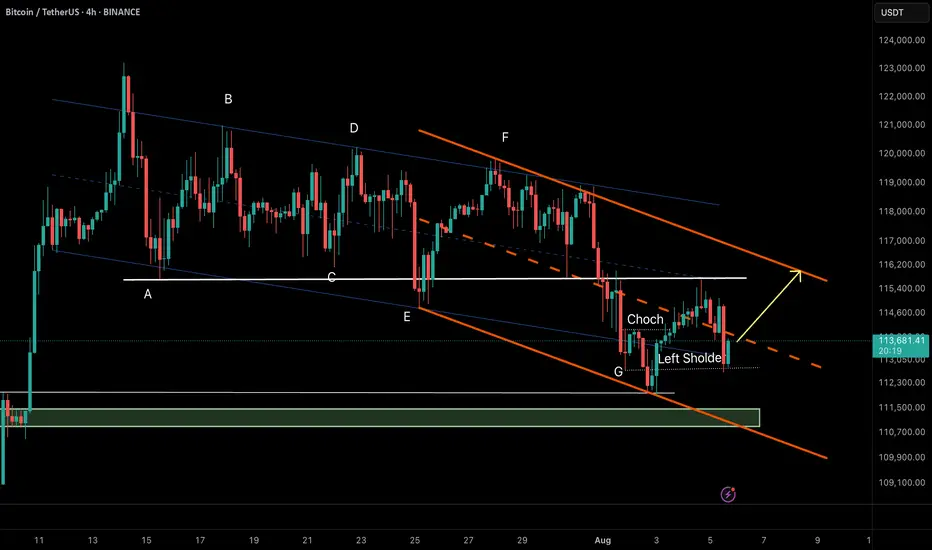
Bitcoin has formed a descending channel after a prolonged correction. Recently, price tapped the channel bottom and printed a CHoCH (Change of Character), indicating a potential reversal.
The price has now retraced to the left shoulder of a potential inverse head & shoulders pattern—an RTM classic structure—which held as support, suggesting bullish continuation.
⸻
🔸 Key Technical Signals:
• ✅ CHoCH confirmed at demand zone near $112,300
• ✅ Retest of the left shoulder validates bullish structure
• ✅ Holding above the internal bullish trendline
• ✅ Price aiming toward upper channel resistance
⸻
🎯 Target:
$116,200 – Top of the descending channel & next key resistance.
❌ Invalidation:
Break and close below $112,800 would invalidate the current RTM setup and open room for deeper correction.
⸻
📌 Summary:
This is a textbook RTM reversal:
CHoCH → Retracement → Left Shoulder Test → Continuation
As long as the structure holds, we remain bullish toward the channel top.
Trade active
Bitcoin followed the analysis precisely and reached its first resistance at $115,700 (white line), reacting to that level. However, the main resistance lies at the top of the descending channel around $116,000. In my view, Bitcoin has formed a liquidity pool around $115,700 — a potential trap that could trigger many stop-losses once broken, pushing the price toward $116,000. We’ll monitor the price action closely at that level to determine the next move.📊 CryptoPilot – Advanced Technical Analysis for BTC & Altcoins
🔎 Smart Money • Price Action • NeoWave • Multi-Timeframe Context
📩 Contact: @CryptoPilot_1 (Telegram)
📥 Telegram Chanell : @CryptoPilot_Trading
🔎 Smart Money • Price Action • NeoWave • Multi-Timeframe Context
📩 Contact: @CryptoPilot_1 (Telegram)
📥 Telegram Chanell : @CryptoPilot_Trading
Disclaimer
The information and publications are not meant to be, and do not constitute, financial, investment, trading, or other types of advice or recommendations supplied or endorsed by TradingView. Read more in the Terms of Use.
📊 CryptoPilot – Advanced Technical Analysis for BTC & Altcoins
🔎 Smart Money • Price Action • NeoWave • Multi-Timeframe Context
📩 Contact: @CryptoPilot_1 (Telegram)
📥 Telegram Chanell : @CryptoPilot_Trading
🔎 Smart Money • Price Action • NeoWave • Multi-Timeframe Context
📩 Contact: @CryptoPilot_1 (Telegram)
📥 Telegram Chanell : @CryptoPilot_Trading
Disclaimer
The information and publications are not meant to be, and do not constitute, financial, investment, trading, or other types of advice or recommendations supplied or endorsed by TradingView. Read more in the Terms of Use.