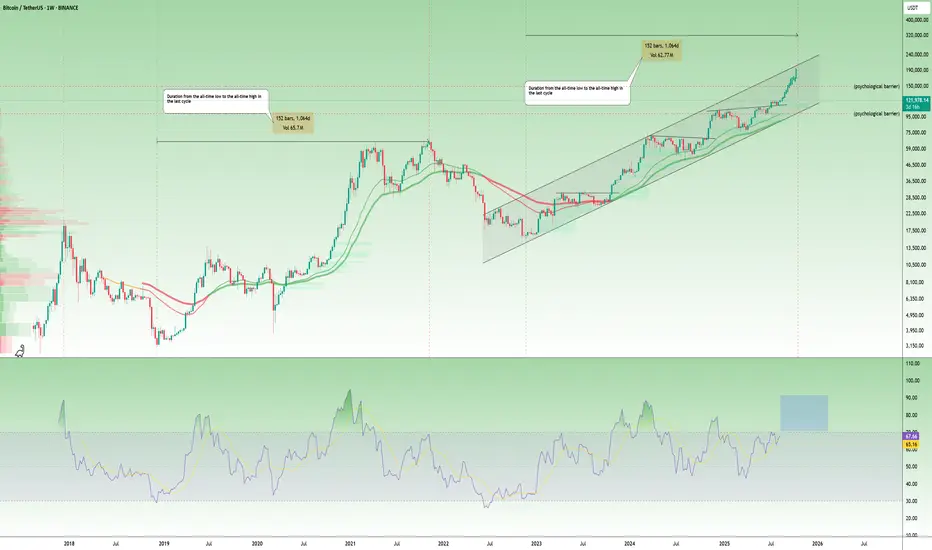
In the last cycle, it took Bitcoin 1,044 days to move from the bear market bottom to a new all-time high. This cycle is on the same timeline, and we’re now well into that phase.
Price is staying inside the long-term rising channel, and momentum is building. If this continues, a macro top could form between late October and early November, maybe even by the first week of October if the rally speeds up.
The RSI is also climbing toward the same overbought levels seen before past tops. The cycle pattern isn’t random.
It’s the guide.
Trade active
A fakeout above the $123K ATH was met with a sharp rejection, sending the price back below the breakout zone.
$120K is now the key pivot, hold here, and bulls may attempt another run.
If we lose it, $114K–$115K support zone comes into play.
The trend remains bullish overall, but short-term momentum has cooled.
Resistance: $123.2K
Support: $120K and $114.2K
keep an eyes on daily candle close.
Note
#BITCOIN Weekly Chart
#Bitcoin printed a new all-time high (ATH) at $124,750, briefly surpassing the previous peak of $123,250. However, the breakout quickly stalled, showing signs of a fakeout as profit-taking pressure emerged near the highs.
⚠️ Failure to hold above the $123K–$125K zone could confirm a rejection and trigger a deeper pullback. Only sustained consolidation above $125K would validate a continuation higher.
Register on BingX and trade with me: 👇
bingx.com/invite/WKCI5X/
Free TG Daily Futures Signals: 👉 t.me/CRYPTOMOJO_TA
bingx.com/invite/WKCI5X/
Free TG Daily Futures Signals: 👉 t.me/CRYPTOMOJO_TA
Disclaimer
The information and publications are not meant to be, and do not constitute, financial, investment, trading, or other types of advice or recommendations supplied or endorsed by TradingView. Read more in the Terms of Use.