Bitcoin (BTC/USDT) 4H Chart Analysis
Key Observations:
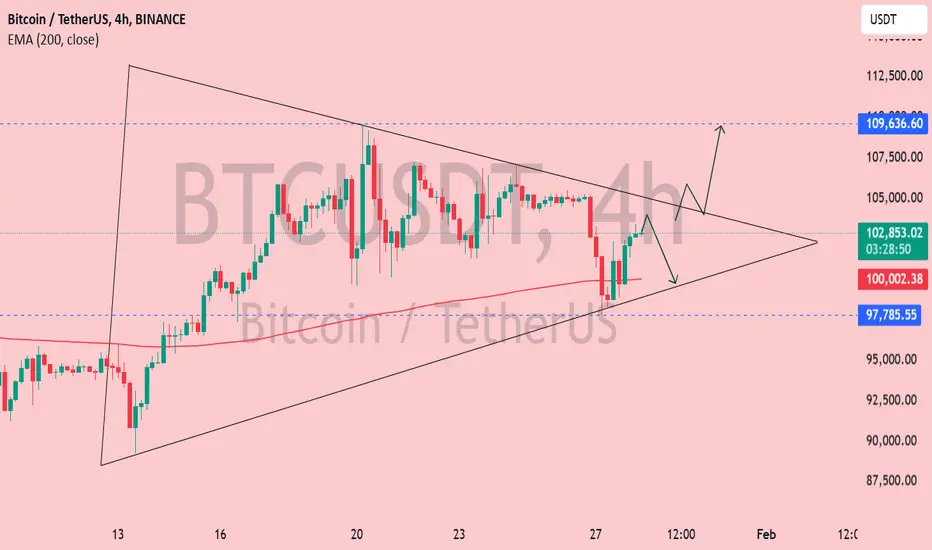
1. Symmetrical Triangle Pattern:
The chart shows a symmetrical triangle formation, characterized by converging trendlines.
This pattern typically signals a breakout, but the direction (up or down) depends on market momentum.
2. Current Price Action:
BTC is trading around $102,979.98 at the time of the chart.
It is above the 200 EMA ($100,003.64), indicating bullish strength.
The price recently bounced off support and is moving towards resistance.
3. Support and Resistance Levels:
Support: Around $97,785.55 (blue line).
Resistance: Around $109,636.60 (blue line).
4. Potential Scenarios:
Bullish Breakout:
If BTC breaks above the upper trendline, it may rally towards $109,636.60 or higher.
A confirmed breakout could push BTC to $112,500+.
Bearish Breakdown:
If BTC rejects at resistance and breaks downward, it could retest the $100,000 level or lower.
A breakdown could target $97,785.55 or even $95,000.
Final Thoughts:
Watch for a breakout or breakdown from the triangle pattern.
Volume is crucial—a high-volume breakout confirms strength, while low volume can indicate a fakeout.
If BTC stays above $100,000 (200 EMA support), the bullish bias remains intact.
Key Observations:
1. Symmetrical Triangle Pattern:
The chart shows a symmetrical triangle formation, characterized by converging trendlines.
This pattern typically signals a breakout, but the direction (up or down) depends on market momentum.
2. Current Price Action:
BTC is trading around $102,979.98 at the time of the chart.
It is above the 200 EMA ($100,003.64), indicating bullish strength.
The price recently bounced off support and is moving towards resistance.
3. Support and Resistance Levels:
Support: Around $97,785.55 (blue line).
Resistance: Around $109,636.60 (blue line).
4. Potential Scenarios:
Bullish Breakout:
If BTC breaks above the upper trendline, it may rally towards $109,636.60 or higher.
A confirmed breakout could push BTC to $112,500+.
Bearish Breakdown:
If BTC rejects at resistance and breaks downward, it could retest the $100,000 level or lower.
A breakdown could target $97,785.55 or even $95,000.
Final Thoughts:
Watch for a breakout or breakdown from the triangle pattern.
Volume is crucial—a high-volume breakout confirms strength, while low volume can indicate a fakeout.
If BTC stays above $100,000 (200 EMA support), the bullish bias remains intact.
Trade active
BTC same movement
Note
wonderfully working BTC JOIN MY TELEGRAM CHANNEL
t.me/StellarMarketAnalysis
JOIN MY RECOMMENTED BROKER REFFREL LINK
⤵️one.exnesstrack.net/a/uvd1etcgg1
PARTNER CODE⤵️
uvd1etcgg1
t.me/StellarMarketAnalysis
JOIN MY RECOMMENTED BROKER REFFREL LINK
⤵️one.exnesstrack.net/a/uvd1etcgg1
PARTNER CODE⤵️
uvd1etcgg1
Related publications
Disclaimer
The information and publications are not meant to be, and do not constitute, financial, investment, trading, or other types of advice or recommendations supplied or endorsed by TradingView. Read more in the Terms of Use.
JOIN MY TELEGRAM CHANNEL
t.me/StellarMarketAnalysis
JOIN MY RECOMMENTED BROKER REFFREL LINK
⤵️one.exnesstrack.net/a/uvd1etcgg1
PARTNER CODE⤵️
uvd1etcgg1
t.me/StellarMarketAnalysis
JOIN MY RECOMMENTED BROKER REFFREL LINK
⤵️one.exnesstrack.net/a/uvd1etcgg1
PARTNER CODE⤵️
uvd1etcgg1
Related publications
Disclaimer
The information and publications are not meant to be, and do not constitute, financial, investment, trading, or other types of advice or recommendations supplied or endorsed by TradingView. Read more in the Terms of Use.