Current Setup:
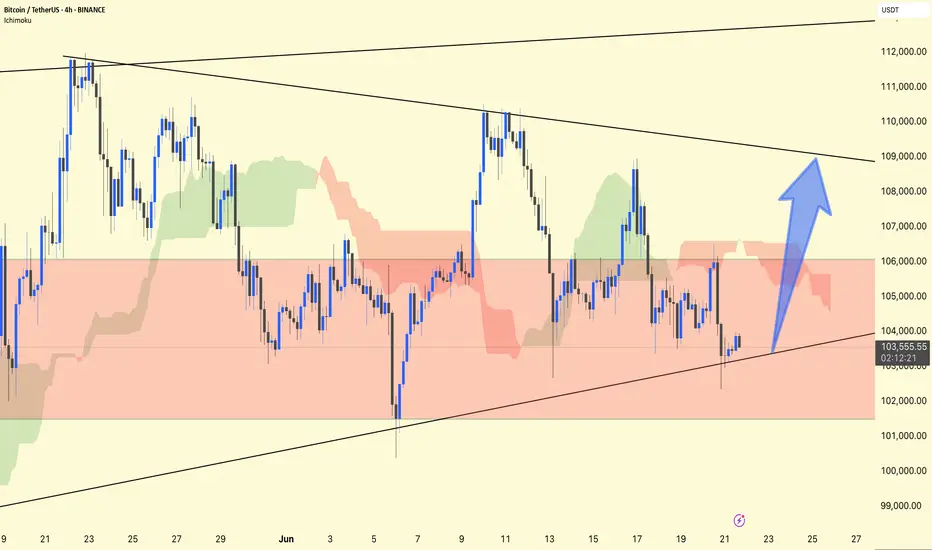
The price hovers within a range (highlighted in red), bouncing off its trendline support.
The RSI at 43 suggests it is close to the oversold zone, indicating a potential recovery.
Bullish Scenario:
If the trendline support holds, a breakout towards $108,000 is highly likely.
(Blue arrow points to the target zone.)
Risk Level:
Watch for a breakdown below the trendline, which could invalidate the bullish setup and send the price towards the $100,000 range.
Trade Plan:
Long entries near trendline support (around $102–103k), with a tight stop loss.
Target the upper trendline (~$108k), adjust as the price develops.
Stay alert!
Related publications
Disclaimer
The information and publications are not meant to be, and do not constitute, financial, investment, trading, or other types of advice or recommendations supplied or endorsed by TradingView. Read more in the Terms of Use.
Related publications
Disclaimer
The information and publications are not meant to be, and do not constitute, financial, investment, trading, or other types of advice or recommendations supplied or endorsed by TradingView. Read more in the Terms of Use.