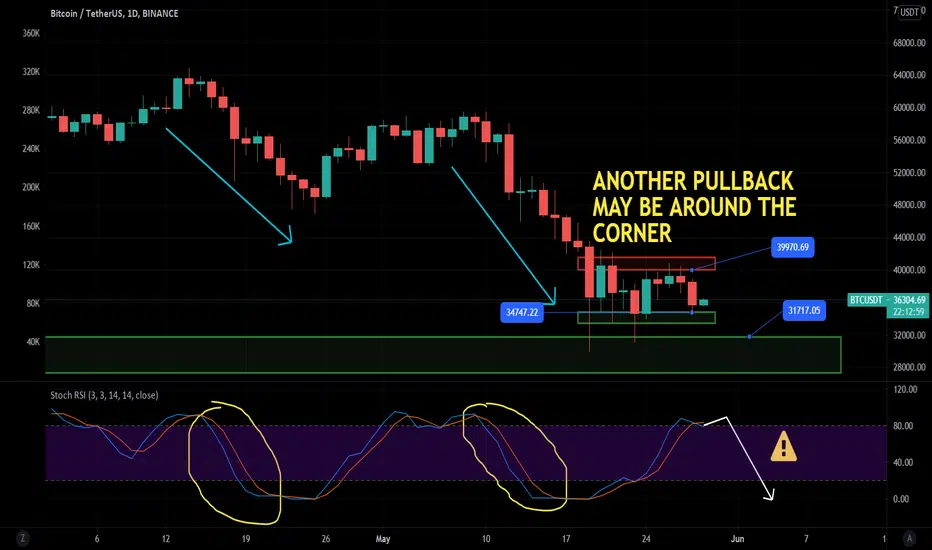
Based on BTC daily chart, it found its temporary support at around $34k where it will probably test its $39k resistance again in the immediate short term.
Stochastic RSI indicates that we will soon have a downward oscillation incoming which in the history had always indicate pullback. I expect a pullback coming after a retest of resistance at $39k which will then form a M pattern in the Stochastic RSI indicator.
Stochastic RSI indicates that we will soon have a downward oscillation incoming which in the history had always indicate pullback. I expect a pullback coming after a retest of resistance at $39k which will then form a M pattern in the Stochastic RSI indicator.
Related publications
Disclaimer
The information and publications are not meant to be, and do not constitute, financial, investment, trading, or other types of advice or recommendations supplied or endorsed by TradingView. Read more in the Terms of Use.
Related publications
Disclaimer
The information and publications are not meant to be, and do not constitute, financial, investment, trading, or other types of advice or recommendations supplied or endorsed by TradingView. Read more in the Terms of Use.