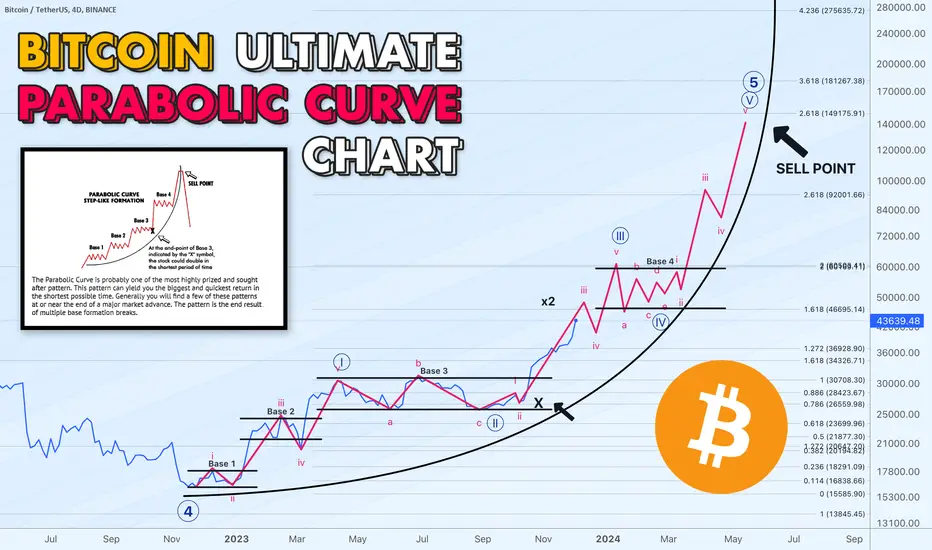
The Parabolic Curve often emerges near the culmination of a major market surge, marking the end result of numerous base formation breaks.
The Parabolic Curve patterns are commonly observed in growth stocks with innovative products, groundbreaking technology, novel business models, or visionary leadership. Typically, these assets represent market leaders — like Bitcoin for crypto.

💡 At the pivotal point of Base 3, symbolized by the "X" on the chart and situated at $25,700, Bitcoin is poised for a potential doubling in the shortest timeframe.
This pattern's hallmark is its staircase-like formation, creating short-term price range bases before catapulting to new highs, repeating the cycle multiple times in its ascent.
I've conducted a detailed analysis using Fibonacci tools and Elliott Waves, projecting Base 4's estimated range between the $60,000 resistance and $46,700 support.
Additionally, considering Fibonacci extensions and channels, the SELL POINT for the parabolic move is anticipated at range between $149,175 and $181,267.00

This parabolic curve, reminiscent of a rocket's trajectory, can endure for weeks or even months. However, caution is warranted as the pattern nears completion. The culmination of the rapid upward momentum often concludes abruptly, plunging in price even faster than its ascent.
Your support means the world, so smash that like button to keep the motivation flowing! 💙💛
The Parabolic Curve patterns are commonly observed in growth stocks with innovative products, groundbreaking technology, novel business models, or visionary leadership. Typically, these assets represent market leaders — like Bitcoin for crypto.
💡 At the pivotal point of Base 3, symbolized by the "X" on the chart and situated at $25,700, Bitcoin is poised for a potential doubling in the shortest timeframe.
This pattern's hallmark is its staircase-like formation, creating short-term price range bases before catapulting to new highs, repeating the cycle multiple times in its ascent.
I've conducted a detailed analysis using Fibonacci tools and Elliott Waves, projecting Base 4's estimated range between the $60,000 resistance and $46,700 support.
Additionally, considering Fibonacci extensions and channels, the SELL POINT for the parabolic move is anticipated at range between $149,175 and $181,267.00
This parabolic curve, reminiscent of a rocket's trajectory, can endure for weeks or even months. However, caution is warranted as the pattern nears completion. The culmination of the rapid upward momentum often concludes abruptly, plunging in price even faster than its ascent.
Note
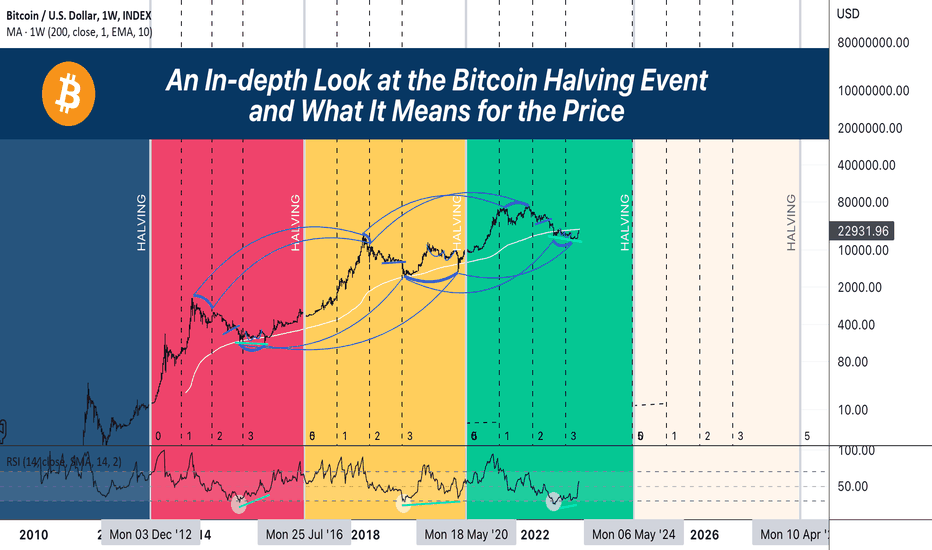
🟢 It's less than 140 days before halving. What is your expected price on halving date April 17, 2024?!Post your numbers in comment box below!
Trade active
Note
CME GAP is quite close to current price range. Should we fill it?
Note
💵 USDT SUPPLY is on ATH 📈
If USDT will continue to be printed out, we going to see continuation of the rally on Bitcoin!
Trade active
#BTC / USDT Update: There is a high chance to get price down to $39,475 where CME Gap is located. I will try to catch this move and setup orders at $40,141 - $39,475.
Note
🎄 Happy New Year Dear TradingView Community!!! 🎄We going to Base 4 pretty soon, $60,000 is on the radar next!
Note
ETF is approved 🧗Trade active
Be extra careful at $60-64K mark!Trade active
Trade active
Hi, it seems there has been a slight shift. We are now at BASE 4 and still forming it. Unless BTC drops below 55k, we're good!📲 Join Telegram Trading Community: t.me/+5hlxWmhHaKplN2Rk
🎙️ 𝘾𝙊𝙈𝙄𝙉𝙂 𝙎𝙊𝙊𝙉 Daily Live Streams on 🔴 𝗬𝗼𝘂𝗧𝘂𝗯𝗲
🔍 linktr.ee/artemcrypto ✅
🎙️ 𝘾𝙊𝙈𝙄𝙉𝙂 𝙎𝙊𝙊𝙉 Daily Live Streams on 🔴 𝗬𝗼𝘂𝗧𝘂𝗯𝗲
🔍 linktr.ee/artemcrypto ✅
Related publications
Disclaimer
The information and publications are not meant to be, and do not constitute, financial, investment, trading, or other types of advice or recommendations supplied or endorsed by TradingView. Read more in the Terms of Use.
📲 Join Telegram Trading Community: t.me/+5hlxWmhHaKplN2Rk
🎙️ 𝘾𝙊𝙈𝙄𝙉𝙂 𝙎𝙊𝙊𝙉 Daily Live Streams on 🔴 𝗬𝗼𝘂𝗧𝘂𝗯𝗲
🔍 linktr.ee/artemcrypto ✅
🎙️ 𝘾𝙊𝙈𝙄𝙉𝙂 𝙎𝙊𝙊𝙉 Daily Live Streams on 🔴 𝗬𝗼𝘂𝗧𝘂𝗯𝗲
🔍 linktr.ee/artemcrypto ✅
Related publications
Disclaimer
The information and publications are not meant to be, and do not constitute, financial, investment, trading, or other types of advice or recommendations supplied or endorsed by TradingView. Read more in the Terms of Use.