The Bitcoin market has once again become the focus of investors. The price of Bitcoin has shown a significant upward trend, successfully breaking through the key resistance level of $106,000 per coin with an intraday increase of over 2%, demonstrating the strong vitality of the market. This price movement not only reflects the warming of positive sentiment in the cryptocurrency market but also indicates the gradual recovery of investor confidence, which has become the core driving force behind Bitcoin's current rally.
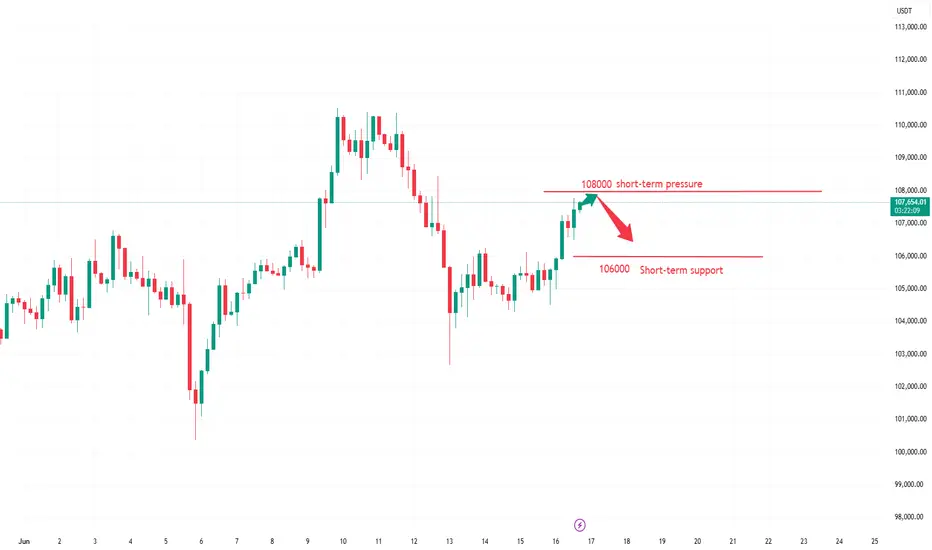
Currently, the Bitcoin price is at a critical juncture. From a daily chart perspective, after reaching an intraday high of $107,265, Bitcoin failed to effectively break through the key resistance level of $108,000 and has since retracted to fluctuate around $106,940. On the 4-hour timeframe, the MACD indicator shows that the histogram remains in positive territory, but the rate of increase has slowed, suggesting a short-term weakening of bullish momentum. Meanwhile, the RSI indicator stands at around 65, approaching the overbought zone, indicating that the market faces short-term correction pressure.
you are currently struggling with losses,or are unsure which of the numerous trading strategies to follow,You have the option to join our VIP program. I will assist you and provide you with accurate trading signals, enabling you to navigate the financial markets with greater confidence and potentially achieve optimal trading results.
Trading Strategy:
sell@107500-108000
TP:106000-106500
You❗️CAN and ❗️SHOULD make money in trading!
t.me/+jqmDDXFtAyNhMjZk
"The Golden Key to Financial Freedom"
t.me/+jqmDDXFtAyNhMjZk\
Join me, I'll guide you to PROFITABLE TRADING💵!
t.me/+jqmDDXFtAyNhMjZk
t.me/+jqmDDXFtAyNhMjZk
"The Golden Key to Financial Freedom"
t.me/+jqmDDXFtAyNhMjZk\
Join me, I'll guide you to PROFITABLE TRADING💵!
t.me/+jqmDDXFtAyNhMjZk
Disclaimer
The information and publications are not meant to be, and do not constitute, financial, investment, trading, or other types of advice or recommendations supplied or endorsed by TradingView. Read more in the Terms of Use.