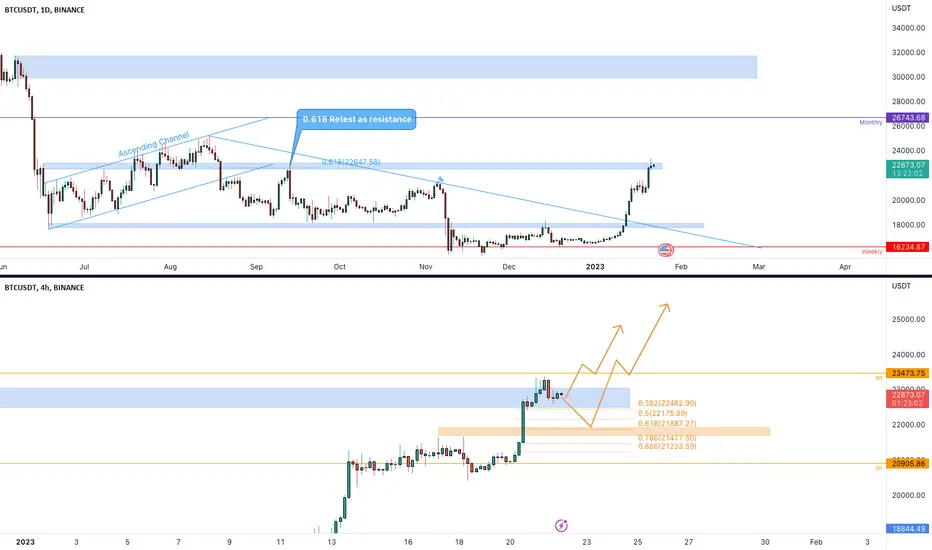
BTCUSDT is testing the 0.618 Fibonacci level as resistance in the long-term technical analysis . The 0.618 Fibonacci level is a key resistance level and breaking above it could indicate further upside potential for BTCUSDT . The next resistance level to watch for is at 26743. However, if the price fails to break above the 0.618 Fibonacci level, it could indicate a potential reversal and a move back down towards the support levels.
The Fibonacci retracement levels also show that the next potential support level is at the 0.618 Fibonacci level, specifically at 21689.56. This is a key level of support, as it has been a significant level of support and resistance in the past. However, if the price fails to hold above the 0.618 Fibonacci level, it could indicate a further retracement and a move down towards the next support levels. This could be a good opportunity for buying the dip.
–––––
Follow the Shrimp 🦐
Keep in mind.
🟣 Purple structure -> Monthly structure.
🔴 Red structure -> Weekly structure.
🔵 Blue structure -> Daily structure.
🟡 Yellow structure -> 4h structure.
⚫️ Black structure -> <= 1h structure.
Follow the Shrimp 🦐
Disclaimer
The information and publications are not meant to be, and do not constitute, financial, investment, trading, or other types of advice or recommendations supplied or endorsed by TradingView. Read more in the Terms of Use.
Disclaimer
The information and publications are not meant to be, and do not constitute, financial, investment, trading, or other types of advice or recommendations supplied or endorsed by TradingView. Read more in the Terms of Use.
