Hello, traders.
If you "Follow", you can always get new information quickly.
Have a nice day today.
-------------------------------------
(BTCUSDT 1D chart)
If it falls below the finger point indicated by the OBV indicator, it can be interpreted that the channel consisting of the High Line ~ Low Line is likely to turn into a downward channel.
And, if it falls to the point indicated by the arrow, it is expected that the channel consisting of the High Line ~ Low Line will turn into a downward channel.
Therefore, if it is maintained above the point indicated by the finger, I think it is likely to show a movement to rise above the High Line.
In this situation, the price is located near the M-Signal indicator on the 1D chart, so its importance increases.
To say that it has turned into a short-term uptrend, the price must be maintained above the M-Signal indicator on the 1D chart.
In that sense, the 106133.74 point is an important support and resistance point.
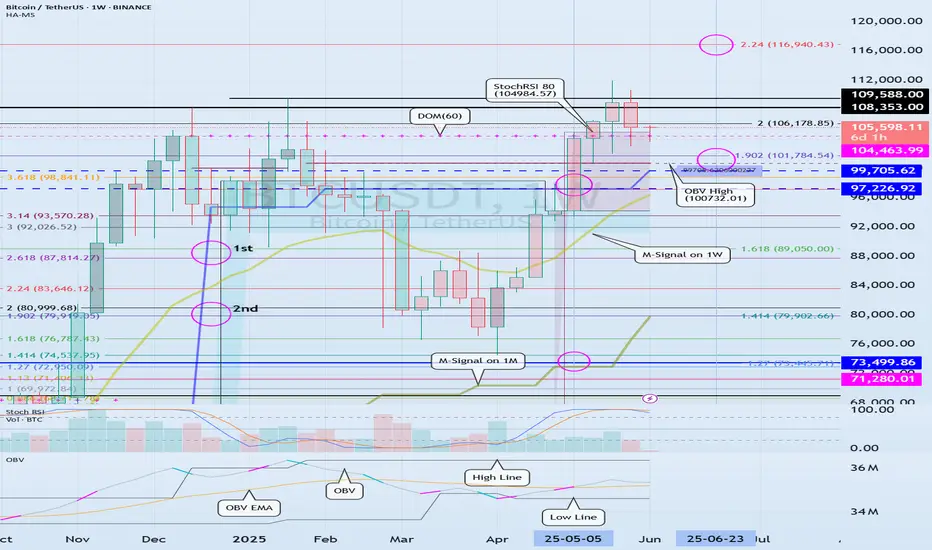
(1W chart)
The HA-High indicator is showing signs of being created at the 99705.62 point.
The fact that the HA-High indicator has been created means that it has fallen from the high point range.
However, since the HA-High indicator receives the value of the Heikin-Ashi chart, it indicates the middle point.
In other words, the value of Heikin-Ashi's Close = (Open + High + Low + Close) / 4 is received.
Since the HA-High indicator has not been created yet, we will be able to know for sure whether it has been created next week.
In any case, it seems to be about to be created, and if it maintains the downward candle, the HA-High indicator will eventually be created anew.
Therefore, I think it is important to be able to maintain the price by rising above the right Fibonacci ratio 2 (106178.85).
Indicators that indicate high points include DOM (60), StochRSI 80, OBV High, and HA-High indicators.
Indicators that indicate these high points are likely to eventually play the role of resistance points.
Therefore,
1st high point range: 104463.99-104984.57
2nd high point range: 99705.62-100732.01
You should consider a response plan depending on whether there is support near the 1st and 2nd above.
The basic trading strategy is to buy at the HA-Low indicator and sell at the HA-High indicator.
However, if it is supported and rises in the HA-High indicator, it is likely to show a stepwise rise, and if it is resisted and falls in the HA-Low indicator, it is likely to show a stepwise decline.
Therefore, the basic trading method should utilize the split trading method.
Other indicators besides the HA-Low and HA-High indicators are auxiliary indicators.
Therefore, the trading strategy in the big picture should be created around the HA-Low and HA-High indicators, and the detailed response strategy can be carried out by referring to other indicators according to the price movement.
In that sense, if we interpret the current chart, it should be interpreted that it is likely to show a stepwise rise since it has risen above the HA-High indicator.
However, you can choose whether to respond depending on whether there is support from other indicators that indicate the high point.
On the other hand, indicators that indicate the low point include the DOM (-60), StochRSI 20, OBV Low, and HA-Low indicators.
These indicators pointing to lows are likely to eventually serve as support points.
I will explain this again when the point pointing to the lows has fallen.
-
Thank you for reading to the end.
I hope you have a successful trade.
--------------------------------------------------
- Here is an explanation of the big picture.
(3-year bull market, 1-year bear market pattern)

I will explain the details again when the bear market starts.
------------------------------------------------------
Note
#BTCUSDT.P 15mThe HA-High indicator, which indicates the high point, is showing signs of being newly created.
Accordingly, if the HA-High indicator is created at the 106199.0 point (a horizontal line must be created to indicate that it is created), the 106025.0-105352.9 section corresponds to the high point section.
You can create a trading strategy depending on whether there is support in this section.
That is, if the HA-High indicator encounters resistance and falls, you can create a sell (SHORT) trading strategy.
The stop loss point is the StochRSI 80 point.
Profit realization section
1st: M-Signal indicator on 1D chart
2nd: DOM(60) indicator on 1W chart (104460.4)
3rd: HA-Low indicator (104095.9)
You can respond depending on whether there is support near the 1st-3rd above.
When you meet the HA-Low indicator, you should consider the existing downward wave as closed and create a trading strategy again depending on whether there is support in the HA-Low indicator.
Note
If you are trying to trade and the price is below the HA-Low indicator as shown in the current chart, I recommend waiting until the next wave.
In other words, the basic trading strategy is to buy at the HA-Low indicator and sell at the HA-High indicator.
Therefore, it is recommended to buy when it shows support near the HA-Low indicator.
If it falls after receiving resistance from the HA-Low indicator, it is likely to show a stepwise downtrend, and if it rises after receiving support from the HA-High indicator, it is likely to show a stepwise uptrend.
Even so, it is recommended that the first trading strategy be carried out in accordance with the basic trading strategy.
The reason is that you will feel it as you trade.
Other content (coins, stocks, etc.) is frequently posted on X.
X에 다른 내용(코인, 주식 등)이 자주 게시.
◆ t.me/readCryptoChannel
[HA-MS Indicator]
bit.ly/3YxHgvN
[OBV Indicator]
bit.ly/4dcyny3
X에 다른 내용(코인, 주식 등)이 자주 게시.
◆ t.me/readCryptoChannel
[HA-MS Indicator]
bit.ly/3YxHgvN
[OBV Indicator]
bit.ly/4dcyny3
Related publications
Disclaimer
The information and publications are not meant to be, and do not constitute, financial, investment, trading, or other types of advice or recommendations supplied or endorsed by TradingView. Read more in the Terms of Use.