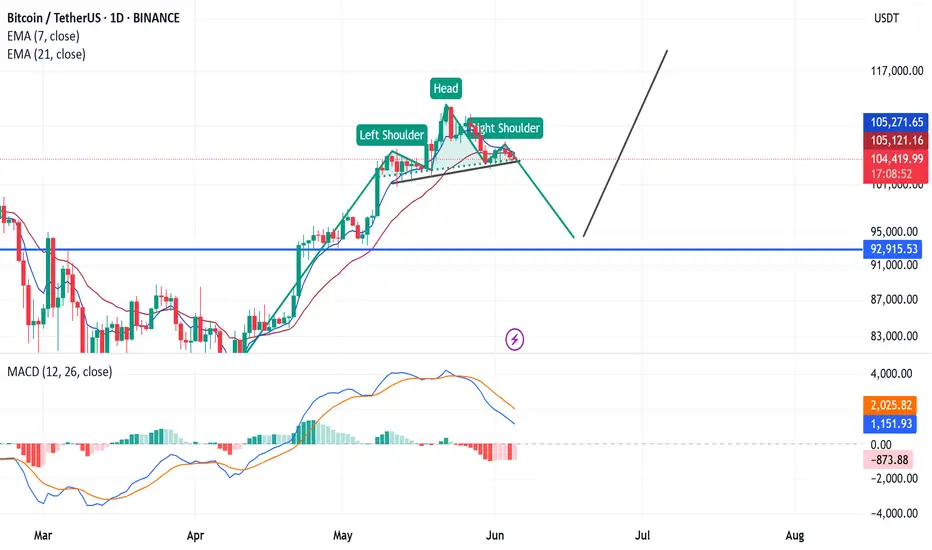
🔍 Chart Pattern: Head and Shoulders
Left Shoulder: Formed with a moderate high and volume increase.
Head: Highest peak, clearly above the shoulders.
Right Shoulder: Lower than the head, approximately at the same level as the left shoulder.
Neckline: Slight upward sloping support line connecting the two troughs — currently being tested.
⛔ This is a classic bearish reversal pattern. If price breaks below the neckline, a strong downtrend could follow.
📉 Indicators:
EMA 7 & EMA 21:
Price is currently below both EMA7 and EMA21, indicating short-term and medium-term weakness.
EMA7 crossing below EMA21 = Bearish signal.
MACD:
MACD line is dropping significantly, showing momentum loss.
A bearish crossover (MACD line below signal line) may confirm further downside.
📌 Possible Scenarios:
Bearish Breakout: If price breaks the neckline, BTC could drop toward the major support zone around 92,915 USDT (blue horizontal line).
Bullish Rebound: If price bounces from the neckline, a recovery move may happen — watch for price to reclaim the EMAs and form a higher high.
📊 Summary:
Pattern: Head & Shoulders – signals a potential trend reversal.
Current trend: Bearish (price below EMAs, MACD weakening).
Key support zone: 92,915 USDT.
Strategy: Wait for confirmation of neckline break for potential short entry. Otherwise, a strong bounce could justify a buy trade with tight risk control.
P/s: By ChatGPT
Disclaimer
The information and publications are not meant to be, and do not constitute, financial, investment, trading, or other types of advice or recommendations supplied or endorsed by TradingView. Read more in the Terms of Use.
Disclaimer
The information and publications are not meant to be, and do not constitute, financial, investment, trading, or other types of advice or recommendations supplied or endorsed by TradingView. Read more in the Terms of Use.