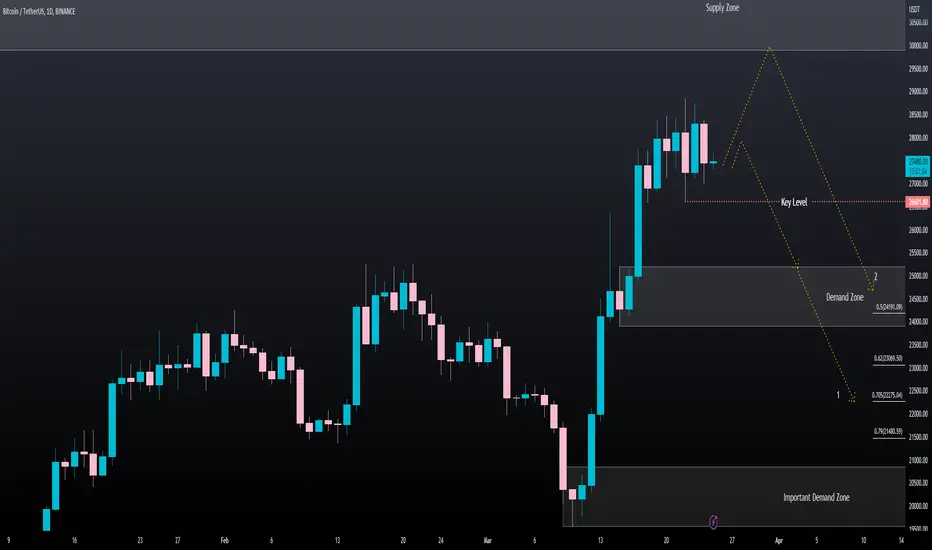
As you can see, I see this chart as bearish.
In that case, the price can start correction from here or try 30K till important supply zone, and then the price drop to the demand zone or even more.
You can see all the important zones and levels on the chart.
If you have questions, feel free to ask.
💡Wait for the update!
🗓️25/03/2023
🔎 DYOR
💌It is my honor to share your comments with me💌
👑Join my free Telegram channel: t.me/TradingFX_ICT
Related publications
Disclaimer
The information and publications are not meant to be, and do not constitute, financial, investment, trading, or other types of advice or recommendations supplied or endorsed by TradingView. Read more in the Terms of Use.