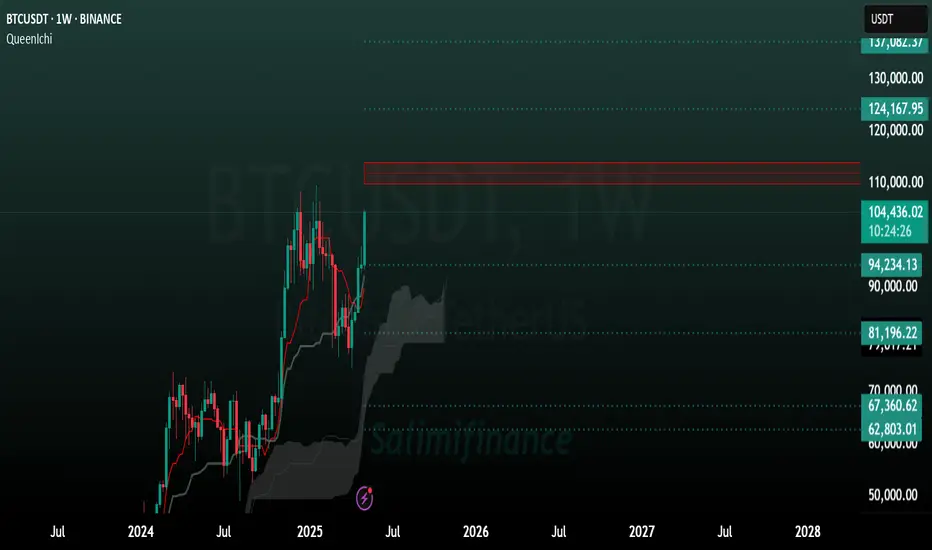
In the previous analysis, the zone of 70 was determining level for us, whether it was a correction or a downward trend.
BTC continued it's upward movement from near that area.
Now Bitcoin is near it's historical resistance area, this time the zone of 110 to 114 plays this role for us.
According to ICHIMOKU and according to previous analysis, Bitcoin tends to move to higher levels marked on the chart.
BTC continued it's upward movement from near that area.
Now Bitcoin is near it's historical resistance area, this time the zone of 110 to 114 plays this role for us.
According to ICHIMOKU and according to previous analysis, Bitcoin tends to move to higher levels marked on the chart.
Disclaimer
The information and publications are not meant to be, and do not constitute, financial, investment, trading, or other types of advice or recommendations supplied or endorsed by TradingView. Read more in the Terms of Use.
Disclaimer
The information and publications are not meant to be, and do not constitute, financial, investment, trading, or other types of advice or recommendations supplied or endorsed by TradingView. Read more in the Terms of Use.