Hello, traders.
Please "Follow" to get the latest information quickly.
Have a nice day today.
-------------------------------------
This volatility period is expected to last until July 11th.
The first volatility period, July 1-7, 3 days passed, and the second volatility period began on July 6.
It is important to explain it in words, but I think it would be better if you could intuitively understand the flow by looking at the chart.
For that reason, I divided the chart into a chart with a trend line drawn and a chart with indicators.
Since the trend line is used as a tool to calculate the volatility period, it is not necessary to show it after the volatility period is displayed.
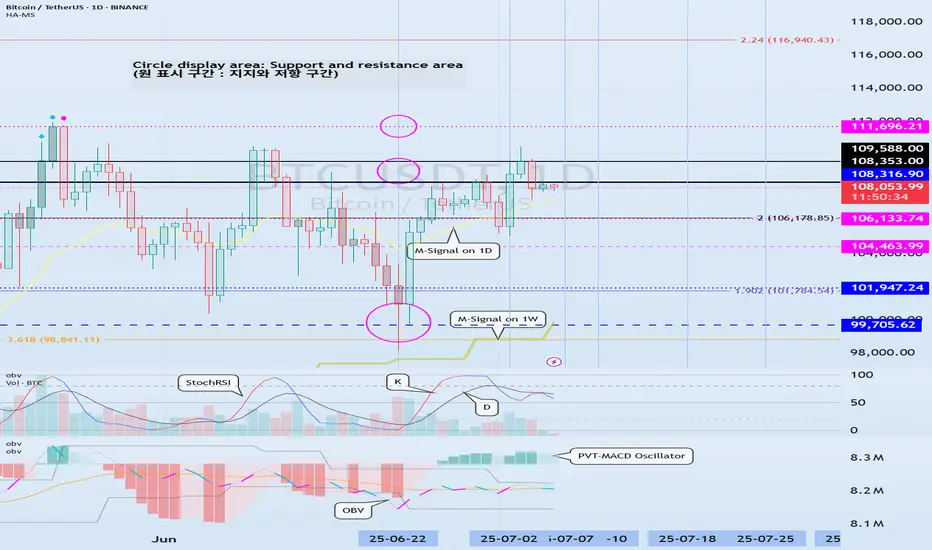
What we need to look at is the support and resistance points drawn on the 1M, 1W, and 1D charts after the calculated volatility period, or the support in the indicator to find the trading point.
-
It seems that support is being checked around 108316.90, which is the HA-High indicator point of the 1D chart.
Therefore, we need to see if it can rise after receiving support near 108316.90 during this volatility period.
If not, it will eventually show a downward trend.
As a basic trading strategy, we use buying near the HA-Low indicator and selling near the HA-High indicator.
Therefore, considering the current price position, it can be said that it is a section where we should sell to make a profit.
However, since the HA-Low and HA-High indicators are intermediate values, if it falls from the HA-Low indicator, it is possible to show a stepwise downward trend, and if it rises from the HA-High indicator, it is possible to show a stepwise upward trend.
Therefore, we need to respond with a split transaction.
Conditions for continuing the uptrend include:
1. When OBV is above the High Line and shows an upward trend,
2. When PVT-MACD oscillator is above the High Line,
3. When StochRSI is above K > D, showing an upward trend,
If the above conditions are met, there is a high possibility that the uptrend will continue.
-
If it falls below the M-Signal indicator on the 1D chart, it is highly likely that it will select the trend again when it meets the M-Signal indicator on the 1W chart.
At this time, whether there is support near 99705.62 is important.
If it rises, you should check whether it is supported near 111696.21.
If it is not supported, it means that it has not broken through the high point section, so you should prepare for a decline.
The high point boundary section is the 108316.90-111696.21 section.
Therefore, if the price is maintained within this section, there is a possibility that it will continue to attempt to break through upward.
-
Thank you for reading to the end.
I hope you have a successful trade.
--------------------------------------------------
- Here is an explanation of the big picture.
(3-year bull market, 1-year bear market pattern)

I will explain more details when the bear market starts.
------------------------------------------------------
Note
OBV(0) indicator is an indicator formed when OBV passes the 0 point.
In other words, if OBV is maintained above the 0 point, it means that the buying force is dominant, and if it is maintained below the 0 point, it means that the selling force is dominant.
As you can see from the formula, since it searches for the entire value of the time frame chart, it may show different results from the OBV of existing auxiliary indicators.
Currently, OBV(0) is formed at the 109762.64 point on the 15m chart.
Therefore, the 109762.64 point is likely to play the role of support and resistance as a volume profile section.
Note
Unlike the spot chart, the OBV(0) indicator is formed at the 108767.3 point on the futures chart.
In other words, it appears that the current buying trend is dominant on the futures chart.
Note
It is most important to look at the time frame chart you are actually trading and create a corresponding response strategy.To do this, you must have a well-established concept of basic trading strategies.
Otherwise, you may be swayed by the volatility shown on the chart and trade in the wrong direction.
The basic trading strategy I am talking about is to buy near the HA-Low indicator and sell near the HA-High indicator.
However, if the HA-Low indicator falls, there is a possibility of a stepwise downtrend, and if the HA-High indicator rises, there is a possibility of a stepwise uptrend.
Therefore, you should respond with a split transaction.
No matter what kind of chart analysis you do, support and resistance points are essential, and you have no choice but to trade based on whether there is support or not.
Therefore, I think the most important thing in chart analysis is to find support and resistance points.
There is no need for anything else, and you should be careful that you may get confused by analyzing more charts.
Trade active
#BTCUSDTThis volatility period is expected to last until July 11th.
The 108316.90 point is the HA-High indicator point, so if it is supported near this point, it is likely to show a step-up trend.
However, since the DOM (60) indicator is located at the 111696.21 point, the step-up trend is expected to start when it rises above 111696.21.
If it encounters resistance at the 108316.90 point and falls, it can basically fall until it meets the HA-Low indicator.
However, since there are support and resistance points, we need to check the movement at important points.
The HA-Low indicator is currently formed at the 89294.25 point.
If the M-Signal indicator on the 1D chart continues to touch, there is a high possibility that it will eventually fall, so you should consider a countermeasure for this.
※ Follow X to check out the posts.
※ X를 팔로우하고 게시물을 확인하세요.
◆ t.me/readCryptoChannel
[HA-MS Indicator]
bit.ly/3YxHgvN
[OBV Indicator]
bit.ly/4dcyny3
※ X를 팔로우하고 게시물을 확인하세요.
◆ t.me/readCryptoChannel
[HA-MS Indicator]
bit.ly/3YxHgvN
[OBV Indicator]
bit.ly/4dcyny3
Related publications
Disclaimer
The information and publications are not meant to be, and do not constitute, financial, investment, trading, or other types of advice or recommendations supplied or endorsed by TradingView. Read more in the Terms of Use.