💀 Hey , how's it going ? Come over here — Satoshi got something for you !
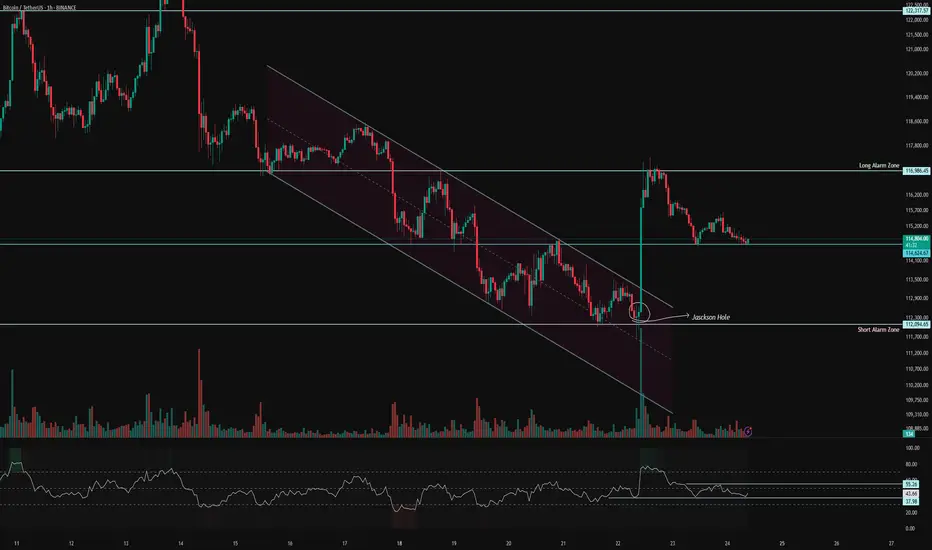
⏰ We’re analyzing BTC on the 1-hour timeframe timeframe .
👀 On the 1-hour timeframe of Bitcoin, we can see that Bitcoin has still maintained a good bullish trend after breaking out of the channel and is currently in correction, but it hasn’t yet formed a proper structure for trades.
⚙️ The key RSI zones are 40 and 70. When the oscillator crosses these levels, trading volatility increases and this will cause price movement.
🕯 Candle size and volume grew during the Jackson Hole event, but since the market is in holidays, there isn’t much volume present. We need to wait for the opening of the next weekly candle for volume to enter the market.
💵 On the 1-hour timeframe of USDT.D , we can see that during the Jackson Hole event, Tether dominance moved strongly downward into an oversold area, and a large amount of Tether entered the market.

🔔 Bitcoin alarm zones are still the same as before. Breaking these levels can give us positions. Since Bitcoin hasn’t built a complete structure yet and the market is in holidays, we won’t take trades.
❤️ Disclaimer : This analysis is purely based on my personal opinion and I only trade if the stated triggers are activated .
⏰ We’re analyzing BTC on the 1-hour timeframe timeframe .
👀 On the 1-hour timeframe of Bitcoin, we can see that Bitcoin has still maintained a good bullish trend after breaking out of the channel and is currently in correction, but it hasn’t yet formed a proper structure for trades.
⚙️ The key RSI zones are 40 and 70. When the oscillator crosses these levels, trading volatility increases and this will cause price movement.
🕯 Candle size and volume grew during the Jackson Hole event, but since the market is in holidays, there isn’t much volume present. We need to wait for the opening of the next weekly candle for volume to enter the market.
💵 On the 1-hour timeframe of USDT.D , we can see that during the Jackson Hole event, Tether dominance moved strongly downward into an oversold area, and a large amount of Tether entered the market.
🔔 Bitcoin alarm zones are still the same as before. Breaking these levels can give us positions. Since Bitcoin hasn’t built a complete structure yet and the market is in holidays, we won’t take trades.
❤️ Disclaimer : This analysis is purely based on my personal opinion and I only trade if the stated triggers are activated .
join our Telegram channel for more insightful and educational content .
t.me/satoshiframe
t.me/satoshiframe
Related publications
Disclaimer
The information and publications are not meant to be, and do not constitute, financial, investment, trading, or other types of advice or recommendations supplied or endorsed by TradingView. Read more in the Terms of Use.