🧠 In-Depth Technical Analysis (BTCUSDT – Weekly Timeframe)
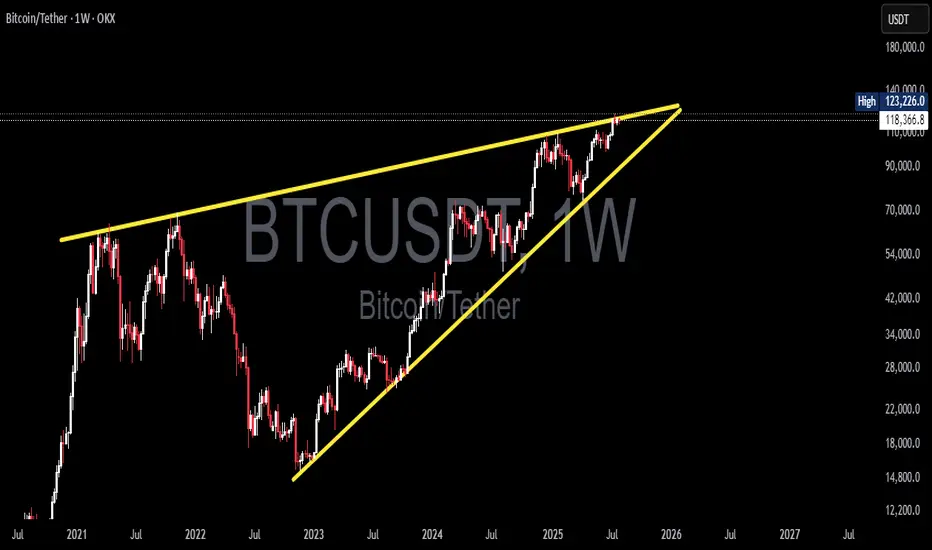
Bitcoin is currently trading within a large Rising Wedge pattern, formed over the long term from late 2022 to mid-2025. This structure is typically a bearish reversal formation, although it can also lead to a breakout in strong bull markets.
The wedge is defined by:
Consistently higher lows on the lower trendline
A gradually rising upper resistance line that currently caps price around $123K–$125K
Decreasing volume, indicating consolidation and energy buildup near the apex
This wedge reflects a period of euphoric price action post-2022 bear market accumulation, with price now testing the top of a historically significant resistance zone.
---
📊 Key Price Levels:
🔹 Current Price: ≈ $118,436
🔹 Recent Weekly High: $123,226
🔹 Critical Resistance (Wedge Top): $123,000–$125,000
🔹 Dynamic Support: Rising wedge base (~$90,000–$95,000)
---
🐂 Bullish Scenario: “Historic Breakout Incoming”
If BTC successfully breaks above the wedge’s upper resistance and closes a weekly candle above $125K with strong volume, it would signal a confirmed breakout from the long-term wedge structure.
📈 Upside Targets:
🎯 Target 1: $140,000
🎯 Target 2: $155,000+ (based on Fibonacci extension and macro targets)
🚀 A breakout of this magnitude may trigger a new parabolic rally, especially if accompanied by:
Increased institutional adoption
Spot ETF inflows
Favorable macroeconomic shifts (e.g., rate cuts)
---
🐻 Bearish Scenario: “False Breakout or Breakdown Risk”
If Bitcoin fails to break out and faces strong rejection from the resistance zone (possibly a false breakout), the rising wedge formation may break down — leading to a steep correction.
📉 A breakdown from this structure often leads to sharp drops due to:
Overextension of the current trend
Distribution phase by smart money
🎯 Downside Targets:
Support 1: $95,000–$90,000
Support 2: $76,000
Major Support: $54,000 (historical demand & EMA zones)
---
🔍 Optional Indicators for Chart Confirmation:
Weekly RSI: Watch for bearish divergence
Volume Profile: Can highlight distribution or accumulation zones
EMA 21/50: Ideal for identifying dynamic support levels in retracements
---
📌 Conclusion:
Bitcoin is at a crucial inflection point within this multi-year Rising Wedge. A confirmed breakout could lead to new all-time highs, while a breakdown may trigger a broad correction. Traders should prepare for high volatility, wait for clear confirmation signals, and manage risk wisely in this pivotal zone.
#Bitcoin #BTCUSDT #RisingWedge #BTCBreakout #TechnicalAnalysis #CryptoMarket #PriceAction #BearishReversal #CryptoSignal #ChartPattern #BitcoinAnalysis #Cryptocurrency
✅ Get Free Signals! Join Our Telegram Channel Here: t.me/TheCryptoNuclear
✅ Twitter: twitter.com/crypto_nuclear
✅ Join Bybit : partner.bybit.com/b/nuclearvip
✅ Benefits : Lifetime Trading Fee Discount -50%
✅ Twitter: twitter.com/crypto_nuclear
✅ Join Bybit : partner.bybit.com/b/nuclearvip
✅ Benefits : Lifetime Trading Fee Discount -50%
Disclaimer
The information and publications are not meant to be, and do not constitute, financial, investment, trading, or other types of advice or recommendations supplied or endorsed by TradingView. Read more in the Terms of Use.