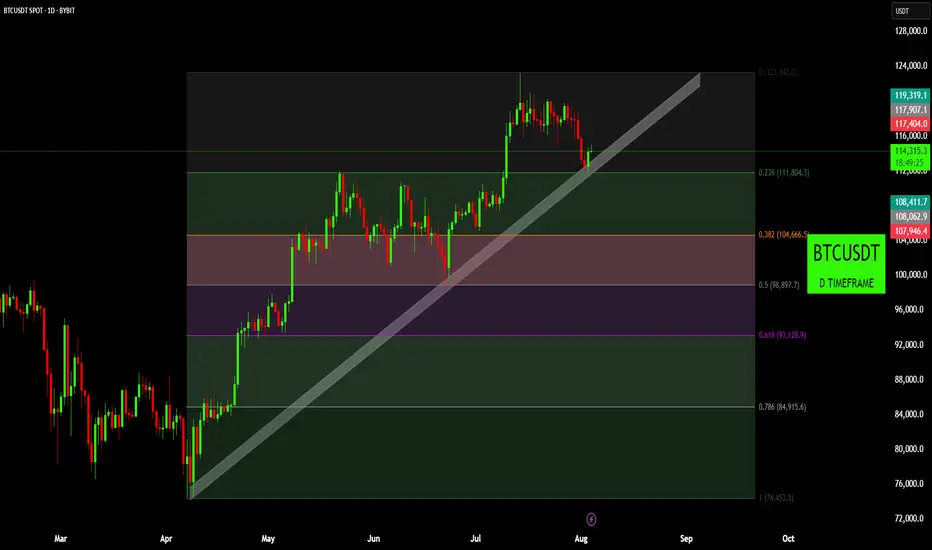
BTCUSDT: A Bullish Foundation Meets Fibonacci Firepower
BTCUSDT is currently at a critical juncture, navigating a significant upward trendline and a key Fibonacci retracement level. The chart highlights the ongoing battle between buyers and sellers following a strong multi-month rally. Price action is testing a major confluence zone, which will likely determine the immediate future direction of the market.
1. The Bullish Foundation (Late March - July):
• Long-Term Uptrend Line (White): A prominent upward-sloping trendline originating from the late March lows has defined the bullish narrative. Price has consistently found support on this line, demonstrating a strong underlying buying interest and a disciplined ascent. This trendline has been a reliable gauge of the market's health and a key area for bulls to defend.
• Fibonacci Retracement Levels: When we apply the Fibonacci retracement tool from the recent swing low to the all-time high, several potential support areas are identified. These levels are critical for understanding potential pullbacks and market structure.
2. The Current Inflection Point (Late July - August):
• Confluence Zone: The market is currently engaging with a high-stakes confluence zone. This area is defined by two key technical indicators:
o The Long-Term Uptrend Line: Price is testing this foundational support line for the first time since the July peak. A bounce from this level would reinforce the long-term bullish bias.
o The 0.236 Fibonacci Level (~$111,804): This is the first level of support in the Fibonacci sequence. The market is finding temporary footing here, and a decisive break below this level would be a bearish signal, suggesting a deeper retracement is likely.
3. Potential Scenarios:
• Bullish Continuation: The most optimistic scenario involves a successful defense of the current confluence zone. A strong bounce from the white uptrend line and the 0.236 Fibonacci level, backed by increased buying volume, would signal that the bulls are still in control. In this case, a re-test of the recent all-time highs would be the next logical target.
• Bearish Retracement: If the confluence zone fails to hold, and BTCUSDT breaks decisively below the trendline and the 0.236 Fibonacci level, it would suggest a deeper correction is underway. The next major support zone to monitor would be:
o The 0.382 Fibonacci Level (~$104,666): This level has historically acted as both support and resistance, making it a critical psychological and technical area. A drop to this zone would likely be met with renewed buying interest.
o The 0.5 Fibonacci Level (~$98,897): A move to this level would signal a more significant correction, potentially testing the psychological $100,000 mark.
Conclusion:
BTCUSDT is at a pivotal moment. The market's reaction to the current confluence of the long-term uptrend line and the 0.236 Fibonacci retracement level will dictate the short-to-medium-term direction. A bounce from here would confirm the strength of the uptrend, while a break lower would open the door for a deeper retracement toward the next key Fibonacci levels. Traders should closely monitor price action and volume at these critical levels for confirmation of the next directional move.
Disclaimer:
The information provided in this chart is for educational and informational purposes only and should not be considered as investment advice. Trading and investing involve substantial risk and are not suitable for every investor. You should carefully consider your financial situation and consult with a financial advisor before making any investment decisions. The creator of this chart does not guarantee any specific outcome or profit and is not responsible for any losses incurred as a result of using this information. Past performance is not indicative of future results. Use this information at your own risk. This chart has been created for my own improvement in Trading and Investment Analysis. Please do your own analysis before any investments.
Disclaimer
The information and publications are not meant to be, and do not constitute, financial, investment, trading, or other types of advice or recommendations supplied or endorsed by TradingView. Read more in the Terms of Use.
Disclaimer
The information and publications are not meant to be, and do not constitute, financial, investment, trading, or other types of advice or recommendations supplied or endorsed by TradingView. Read more in the Terms of Use.