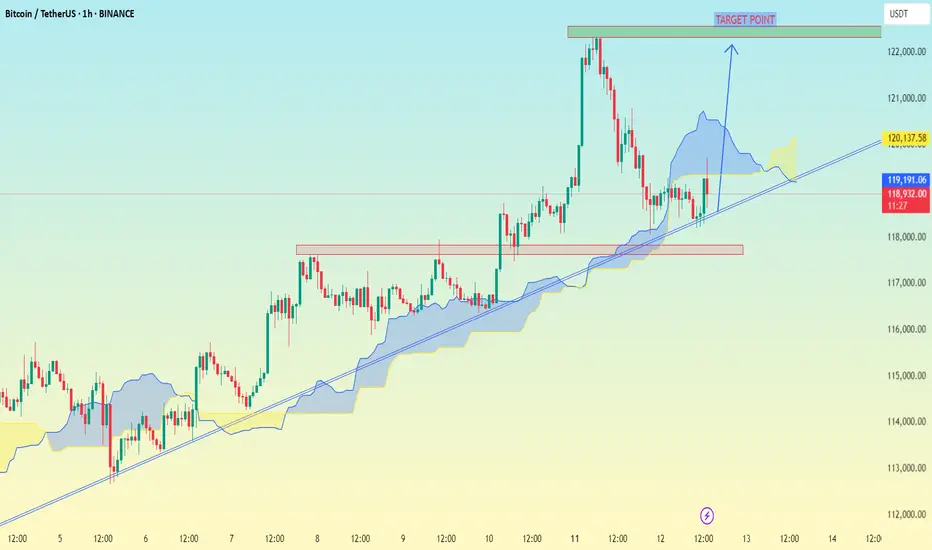
From this updated chart, "TARGET POINT" label more clearly.
The horizontal green box you marked is roughly between $122,000 and $123,000 (though this seems like a different scale—possibly a derivative or index, not direct BTC price in USD).
The price is breaking above the descending trendline and heading toward that high-volume resistance zone.
The main targets I see from your own chart markings are:
First target: around $118,991 (blue label) — likely the nearest resistance.
Second target: around $120,137 (yellow label) — next key high-volume node.
Final target (your green box): around $122,000–$123,000.
These seem to be based on volume profile gaps and resistance levels.
Trade active
trade activeTrade closed: target reached
Target done t.me/forexofdollarsmagnet
Forex, gold and crypto signal's with detailed analysis & get consistent results..
t.me/Jhonscalpertrade11
Gold signal's with proper TP & SL for high profits opportunities..
Forex, gold and crypto signal's with detailed analysis & get consistent results..
t.me/Jhonscalpertrade11
Gold signal's with proper TP & SL for high profits opportunities..
Related publications
Disclaimer
The information and publications are not meant to be, and do not constitute, financial, investment, trading, or other types of advice or recommendations supplied or endorsed by TradingView. Read more in the Terms of Use.
t.me/forexofdollarsmagnet
Forex, gold and crypto signal's with detailed analysis & get consistent results..
t.me/Jhonscalpertrade11
Gold signal's with proper TP & SL for high profits opportunities..
Forex, gold and crypto signal's with detailed analysis & get consistent results..
t.me/Jhonscalpertrade11
Gold signal's with proper TP & SL for high profits opportunities..
Related publications
Disclaimer
The information and publications are not meant to be, and do not constitute, financial, investment, trading, or other types of advice or recommendations supplied or endorsed by TradingView. Read more in the Terms of Use.