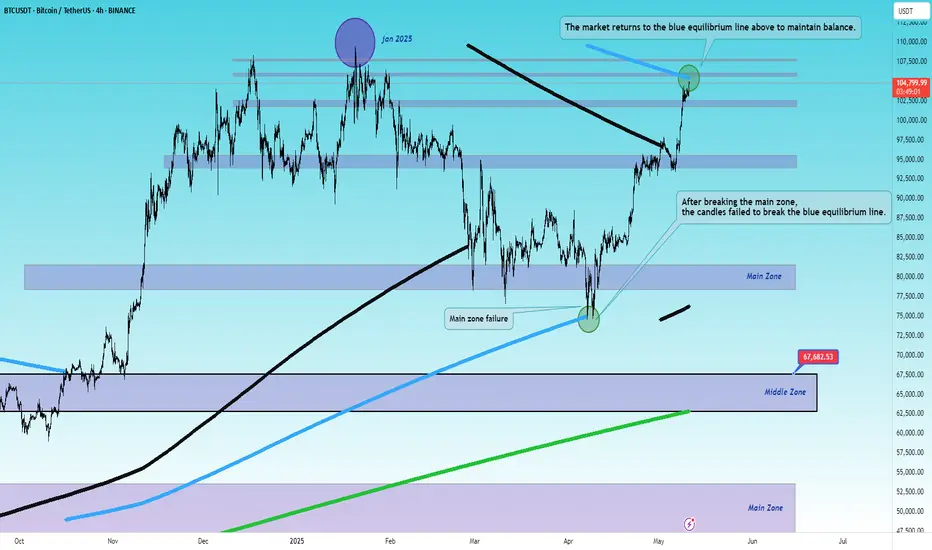
Bitcoin 4-hour chart: Analysis using equilibrium levels and price saturation levels from the January 2025 ceiling: After breaking the main zone, the candles failed to break the blue equilibrium line below, and the candles are turning and hitting the blue equilibrium line above to maintain balance... Due to the main zone breakdown, the candles will reach the middle zone in the medium term... Range of $65,000 to $69,000
Note: Equilibrium analyses may be slightly delayed due to the big-image view of the market, but the targets will be touched in the market.
Note: Equilibrium analyses may be slightly delayed due to the big-image view of the market, but the targets will be touched in the market.
Disclaimer
The information and publications are not meant to be, and do not constitute, financial, investment, trading, or other types of advice or recommendations supplied or endorsed by TradingView. Read more in the Terms of Use.
Disclaimer
The information and publications are not meant to be, and do not constitute, financial, investment, trading, or other types of advice or recommendations supplied or endorsed by TradingView. Read more in the Terms of Use.