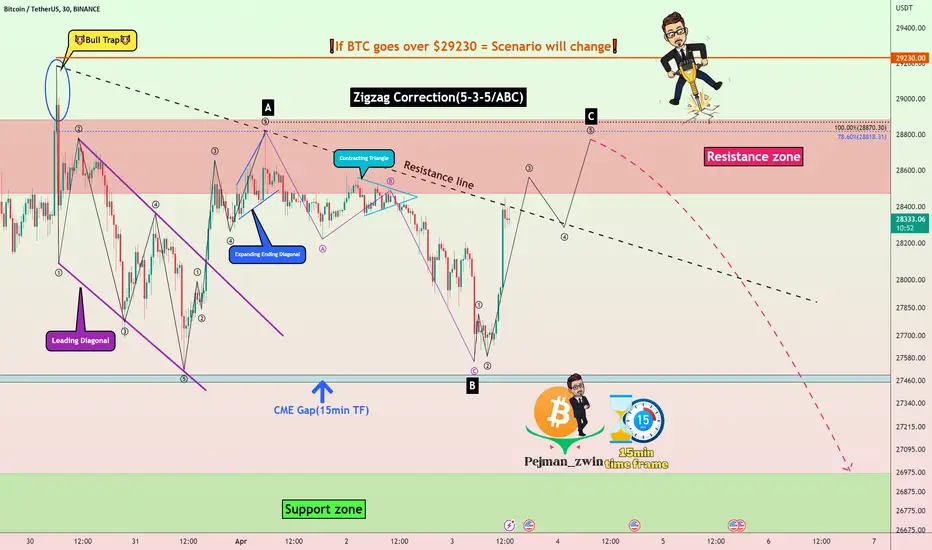
Bitcoin is on its way to completing wave C of the zigzag corrective structure.
The end of wave C is most likely in the 🔴resistance zone($28,900-$28,480)🔴 and most likely in the $28,720-$28,890 range.
After confirming the end of wave C, Bitcoin is expected to finally fill the 🔵CME GAP($27,505-$27,465)🔵 and reach the 🟢support zone ($26,980-$26,580)🟢.
❗️Note❗️: If BTC goes over $29230 Scenario will change.
Bitcoin Analyze ( BTCUSDT ), 15-minute time frame ⏰.
Do not forget to put Stop loss for your positions (For every position you want to open).
Please follow your strategy, this is just my Idea, and I will be glad to see your ideas in this post.
Please do not forget the ✅' like'✅ button 🙏😊 & Share it with your friends; thanks, and Trade safe.
Note
Let's see, BTC can break the resistance lineNote
Bitcoin ended wave C at the 61.8 Fibonacci level
🎁Welcome than a 50% bonus(Low Spread)👉vtm.pro/Y3AV7r
🎁Get a 20% Discount on your trading FEE on BYBIT:👉partner.bybit.com/b/PEJMANZWIN
🎁Get a 20% Bonus & 30% Discount on LBANK exchange(NO KYC)👉lbank.one/join/uBythQd
🎁Get a 20% Discount on your trading FEE on BYBIT:👉partner.bybit.com/b/PEJMANZWIN
🎁Get a 20% Bonus & 30% Discount on LBANK exchange(NO KYC)👉lbank.one/join/uBythQd
Related publications
Disclaimer
The information and publications are not meant to be, and do not constitute, financial, investment, trading, or other types of advice or recommendations supplied or endorsed by TradingView. Read more in the Terms of Use.