This is not clickbait! This is a real working strategy! Read to the end!
Hello!
My name is Michael Hypov!
I have been trading for 16 years, and during this time I have seen it all: booms, crashes, crises, hype, and long periods of market silence.
My articles on technical and fundamental analysis, as well as my forecasts for Forex currencies and cryptocurrencies, are translated into 20 languages and gather millions of views.
But what I want to share with you today became a turning point in my understanding of trading.
How it all began
In 2019, I moved to Malaysia and entered the Universiti Sains Malaysia (USM) — the second most prestigious university in the country after UM.
I was lucky to get into the Master's program in Data Science and Analytics. It was an intensive course where we deeply studied mathematical analysis, statistics, neural networks, and machine learning — at a time when no one had even heard of ChatGPT yet.
This knowledge literally turned my understanding of trading upside down.
I suddenly saw that many market processes could be explained by strict mathematical laws, and therefore — predicted with high accuracy.
A bit of theory in simple terms
One of the key discoveries for me was the law of normal distribution.
Visually, it is represented by the “Gaussian bell” — a symmetrical curve where most values are in the middle, and extreme values are rare.
To make it clearer, let me give you an example.
Imagine baking muffins
The dough is the same for all, and the oven is the same. But the result is always slightly different:
If you draw a chart of “how many muffins of what size,” you’ll get that same bell-shaped curve: many in the center, few on the edges.
Examples from real life
We see the same principle everywhere:
💡 To put it simply: in nature and life, most values are “average,” and extremes are rare.
Why this matters in trading
In trading, the price at any given moment is a random variable.
We cannot know exactly where it will be in a second or an hour, but we can calculate the average value that is most likely to be reached.
If we return to the bell curve, the blue dotted line in the centre is the price the market tends to most often.
For each time frame, you can calculate this average price and use it as a guide.
Box Plot — a chart that says more
The law of normal distribution can be conveniently represented using a Box Plot (“box and whiskers”).
The median = the expected value,
The “box” — the range of 25% deviations,
The “whiskers” — minimum and maximum within 1.5×IQR (where IQR is the size of the box body).
If you plot the asset price along the X-axis and rotate the graph by 90°, the shape will strikingly resemble a Japanese candlestick.
And if you build such “boxes” for different time frames, you get a clear picture of market fluctuations, which in some cases is more informative than a candlestick chart.
Intrabar BoxPlot and two patterns
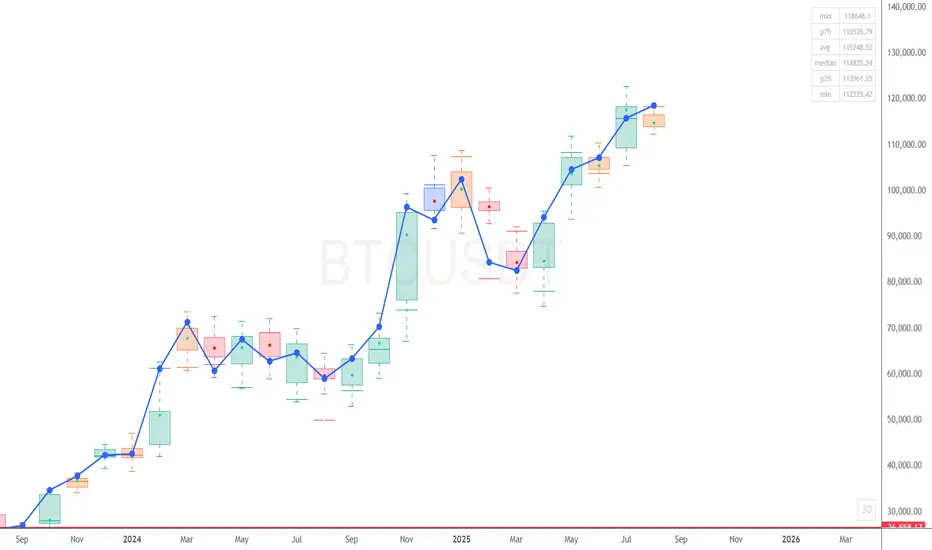
Recently, TradingView introduced the Intrabar BoxPlot indicator. It builds these “boxes” right on the chart and marks the medians and closing prices.

On the chart, these boxes are displayed with colored dots for the medians of each period and blue dots for the closing price levels.
Comparing the price chart with the BoxPlot, you can identify two patterns:
1/ The market always tends toward the median; therefore, with high probability, if the close for the period was within the box, the candle of the next period will reach the median of the last closed candle.
2/ If the close occurred outside the box, this is a signal for a trend continuation. Moreover, the further the closing point is from the median, the stronger the signal for continued movement.
These patterns work both on 12-month candles and on second-level time frames, which makes it possible to conduct cross-analysis from macro to micro trends and build a trading strategy that delivers excellent results: on large time frames, we identify major trends, and on minute and second charts, we determine entry and exit points on micro-waves within the day.
How it turned into a strategy
Three years ago, I decided to turn this observation into a full-fledged trading system.
At first, I wrote a thesis based on this idea, forecasting Bitcoin’s price.
For three years, I tested and refined the algorithm, brought in a team of programmers who helped me build a custom trading bot from scratch.
Since trading requires a limited set of parameters — closing/opening prices, high/low, as well as box parameters and expected value — the bot’s neural model is well trainable and capable of not only conducting cross-analysis but also identifying patterns and inefficiencies in the market on its own. Moreover, the bot self-learns and improves its trading over time.
Results
We trade on Binance futures, with an average leverage of 0.63x — less than one, which almost eliminates the risk of liquidation.
We don’t use stop-losses: if a trade goes against us, the bot moves to a higher time frame and averages the position.
Maximum leverage — 3x.
Backtest results show returns from 100% to 500% per year, depending on the market cycle. On a bear market, we reduce leverage to lower risks, which also reduces returns.
The strategy has now been trading on a real account for more than a month.
The first month of trading brought +31% to the deposit.
Even giving 50% to the fund, when calculating compound interest (with reinvestment of income), your annual income will approach 500%
Thank you very much for reading to the end!
I will be glad to receive your comments under the posts and questions in private messages
Hello!
My name is Michael Hypov!
I have been trading for 16 years, and during this time I have seen it all: booms, crashes, crises, hype, and long periods of market silence.
My articles on technical and fundamental analysis, as well as my forecasts for Forex currencies and cryptocurrencies, are translated into 20 languages and gather millions of views.
But what I want to share with you today became a turning point in my understanding of trading.
How it all began
In 2019, I moved to Malaysia and entered the Universiti Sains Malaysia (USM) — the second most prestigious university in the country after UM.
I was lucky to get into the Master's program in Data Science and Analytics. It was an intensive course where we deeply studied mathematical analysis, statistics, neural networks, and machine learning — at a time when no one had even heard of ChatGPT yet.
This knowledge literally turned my understanding of trading upside down.
I suddenly saw that many market processes could be explained by strict mathematical laws, and therefore — predicted with high accuracy.
A bit of theory in simple terms
One of the key discoveries for me was the law of normal distribution.
Visually, it is represented by the “Gaussian bell” — a symmetrical curve where most values are in the middle, and extreme values are rare.
To make it clearer, let me give you an example.
Imagine baking muffins
The dough is the same for all, and the oven is the same. But the result is always slightly different:
- most muffins turn out average in size
- some are slightly smaller or slightly larger
- very few are either tiny or gigantic.
If you draw a chart of “how many muffins of what size,” you’ll get that same bell-shaped curve: many in the center, few on the edges.
Examples from real life
We see the same principle everywhere:
- uman height — most people are of average height, very short and very tall are rare
- school grades — most students have average grades, and extremes are rare
- apple weight in an orchard — most are about the same, but there are a few very small or very large ones.
💡 To put it simply: in nature and life, most values are “average,” and extremes are rare.
Why this matters in trading
In trading, the price at any given moment is a random variable.
We cannot know exactly where it will be in a second or an hour, but we can calculate the average value that is most likely to be reached.
If we return to the bell curve, the blue dotted line in the centre is the price the market tends to most often.
For each time frame, you can calculate this average price and use it as a guide.
Box Plot — a chart that says more
The law of normal distribution can be conveniently represented using a Box Plot (“box and whiskers”).
The median = the expected value,
The “box” — the range of 25% deviations,
The “whiskers” — minimum and maximum within 1.5×IQR (where IQR is the size of the box body).
If you plot the asset price along the X-axis and rotate the graph by 90°, the shape will strikingly resemble a Japanese candlestick.
And if you build such “boxes” for different time frames, you get a clear picture of market fluctuations, which in some cases is more informative than a candlestick chart.
Intrabar BoxPlot and two patterns
Recently, TradingView introduced the Intrabar BoxPlot indicator. It builds these “boxes” right on the chart and marks the medians and closing prices.
On the chart, these boxes are displayed with colored dots for the medians of each period and blue dots for the closing price levels.
Comparing the price chart with the BoxPlot, you can identify two patterns:
1/ The market always tends toward the median; therefore, with high probability, if the close for the period was within the box, the candle of the next period will reach the median of the last closed candle.
2/ If the close occurred outside the box, this is a signal for a trend continuation. Moreover, the further the closing point is from the median, the stronger the signal for continued movement.
These patterns work both on 12-month candles and on second-level time frames, which makes it possible to conduct cross-analysis from macro to micro trends and build a trading strategy that delivers excellent results: on large time frames, we identify major trends, and on minute and second charts, we determine entry and exit points on micro-waves within the day.
How it turned into a strategy
Three years ago, I decided to turn this observation into a full-fledged trading system.
At first, I wrote a thesis based on this idea, forecasting Bitcoin’s price.
For three years, I tested and refined the algorithm, brought in a team of programmers who helped me build a custom trading bot from scratch.
Since trading requires a limited set of parameters — closing/opening prices, high/low, as well as box parameters and expected value — the bot’s neural model is well trainable and capable of not only conducting cross-analysis but also identifying patterns and inefficiencies in the market on its own. Moreover, the bot self-learns and improves its trading over time.
Results
We trade on Binance futures, with an average leverage of 0.63x — less than one, which almost eliminates the risk of liquidation.
We don’t use stop-losses: if a trade goes against us, the bot moves to a higher time frame and averages the position.
Maximum leverage — 3x.
Backtest results show returns from 100% to 500% per year, depending on the market cycle. On a bear market, we reduce leverage to lower risks, which also reduces returns.
The strategy has now been trading on a real account for more than a month.
The first month of trading brought +31% to the deposit.
Even giving 50% to the fund, when calculating compound interest (with reinvestment of income), your annual income will approach 500%
Thank you very much for reading to the end!
I will be glad to receive your comments under the posts and questions in private messages
500 APY% с низким риском - полная версия статьи здесь!
telegra.ph/500-APY-s-nizkim-riskom---fejk-Fakt-08-10
telegra.ph/500-APY-s-nizkim-riskom---fejk-Fakt-08-10
Related publications
Disclaimer
The information and publications are not meant to be, and do not constitute, financial, investment, trading, or other types of advice or recommendations supplied or endorsed by TradingView. Read more in the Terms of Use.