Hello traders!
If you "Follow" us, you can always get new information quickly.
Please also click “Boost”.
Have a good day.
-------------------------------------
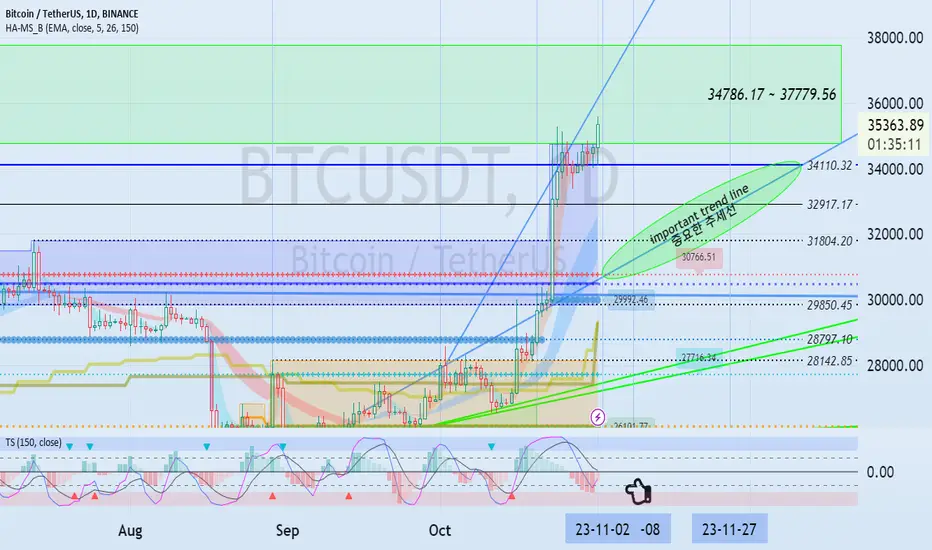
(BTCUSDT chart)

It received support and rose in the 34110.32-34786.17 range.
The still important section is the 29241.72-30767.38 section.
Therefore, if it falls below the 29241.72-29850.45 range, it is likely to turn into a downtrend.
(1D chart)

A period of volatility has just begun.
Therefore, caution is required when trading until the volatility period ends around November 8 (November 7-9).
We need to check whether the StochRSI indicator and the Histogram indicator can continue their upward trend and rise above the 0 point.
Of the three buying opportunities I mentioned before, it is showing an upward trend without creating a pull back pattern, which I said would be the first buying period after BTC rose above 29K.
If it appears to fall below 34110.32 around November 2 (November 1-3), the beginning of the volatility period, you need to check if it is supported around 31804.20-32917.17.
The second time to buy BTC was when a pull back pattern was formed when it fell after resistance near 38531.90.
I will explain this again when the price rises to around 37779.56-38531.90.
--------------------------------------------------
- The big picture

The full-fledged upward trend is expected to begin when the price rises above 29K.
This is the section expected to be touched in the next bull market, 81K-95K.
-------------------------------------------------- -------------------------------------------
** All explanations are for reference only and do not guarantee profit or loss in investment.
** Trading volume is displayed as a candle body based on 10EMA.
How to display (in order from darkest to darkest)
More than 3 times the trading volume of 10EMA > 2.5 times > 2.0 times > 1.25 times > Trading volume below 10EMA
** Even if you know other people’s know-how, it takes a considerable amount of time to make it your own.
** This chart was created using my know-how.
---------------------------------
If you "Follow" us, you can always get new information quickly.
Please also click “Boost”.
Have a good day.
-------------------------------------
(BTCUSDT chart)
It received support and rose in the 34110.32-34786.17 range.
The still important section is the 29241.72-30767.38 section.
Therefore, if it falls below the 29241.72-29850.45 range, it is likely to turn into a downtrend.
(1D chart)
A period of volatility has just begun.
Therefore, caution is required when trading until the volatility period ends around November 8 (November 7-9).
We need to check whether the StochRSI indicator and the Histogram indicator can continue their upward trend and rise above the 0 point.
Of the three buying opportunities I mentioned before, it is showing an upward trend without creating a pull back pattern, which I said would be the first buying period after BTC rose above 29K.
If it appears to fall below 34110.32 around November 2 (November 1-3), the beginning of the volatility period, you need to check if it is supported around 31804.20-32917.17.
The second time to buy BTC was when a pull back pattern was formed when it fell after resistance near 38531.90.
I will explain this again when the price rises to around 37779.56-38531.90.
--------------------------------------------------
- The big picture
The full-fledged upward trend is expected to begin when the price rises above 29K.
This is the section expected to be touched in the next bull market, 81K-95K.
-------------------------------------------------- -------------------------------------------
** All explanations are for reference only and do not guarantee profit or loss in investment.
** Trading volume is displayed as a candle body based on 10EMA.
How to display (in order from darkest to darkest)
More than 3 times the trading volume of 10EMA > 2.5 times > 2.0 times > 1.25 times > Trading volume below 10EMA
** Even if you know other people’s know-how, it takes a considerable amount of time to make it your own.
** This chart was created using my know-how.
---------------------------------
Note
(BTCUSDT.P 4h chart)It started rising above 5EMA on October 15th and has been holding the price above 5EMA so far.
We need to check if it falls below 5EMA this time.
If it falls from 5EMA, you should check if the M-Signal indicator on the 1D chart is rising around 32853.8 and finds support there.
Note
※ Follow X to check out the posts.
※ X를 팔로우하고 게시물을 확인하세요.
◆ t.me/readCryptoChannel
[HA-MS Indicator]
bit.ly/3YxHgvN
[OBV Indicator]
bit.ly/4dcyny3
※ X를 팔로우하고 게시물을 확인하세요.
◆ t.me/readCryptoChannel
[HA-MS Indicator]
bit.ly/3YxHgvN
[OBV Indicator]
bit.ly/4dcyny3
Related publications
Disclaimer
The information and publications are not meant to be, and do not constitute, financial, investment, trading, or other types of advice or recommendations supplied or endorsed by TradingView. Read more in the Terms of Use.