---
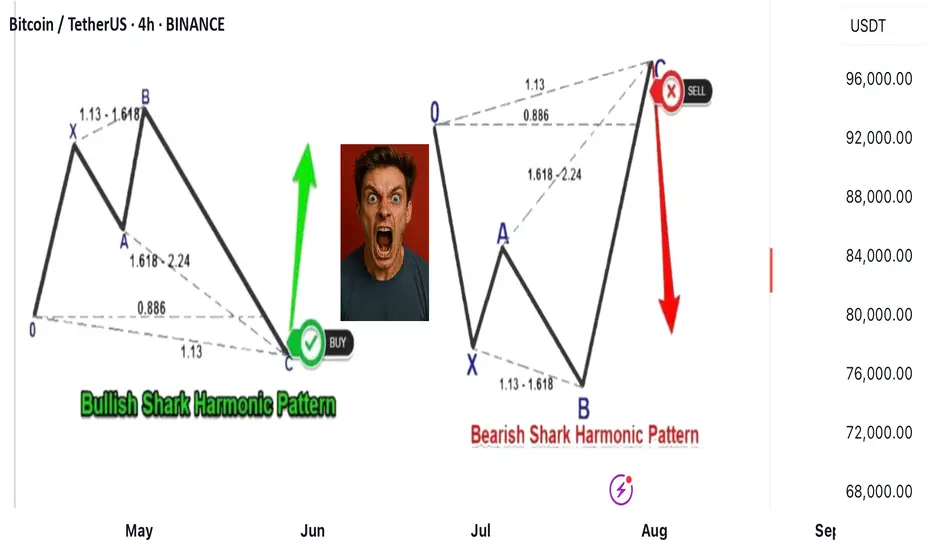
### 🦈 What Is the Shark Harmonic Pattern?
- **Discovered by**: Scott Carney in 2011
- **Foundation**: Combines **Fibonacci ratios** with **Elliott Wave Theory**
- **Purpose**: Identifies potential **trend reversals** using precise geometric price structures
- **Structure**: Five points labeled **O, X, A, B, C** (not the usual XABCD)
- **Key Feature**: Relies heavily on the **88.6% Fibonacci retracement** and **113% extension**
---
### 📐 Pattern Geometry & Ratios
| Leg | Description | Fibonacci Ratio Range |
|------------|--------------------------------------------------|-------------------------------|
| XA | Initial impulse leg | No specific ratio |
| AB | Extension beyond X | 113% to 161.8% of XA |
| BC | Completion leg | 88.6% to 113% of OX |
| | | 161.8% to 224% of AB |
- **Point B** must **exceed point X**, forming an **Extreme Harmonic Impulse Wave**
- **Point C** is the **Potential Reversal Zone (PRZ)**
---
### 🛒 Buy Setup (Bullish Shark)
1. **No fixed retracement for A**
2. **B extends 113%–161.8% of XA**
3. **C completes at**:
- 88.6%–113% of OX
- 161.8%–224% of AB
📍 **Entry**: Near point C
📍 **Stop Loss**: Below point C
📍 **Target**: Retracement levels of BC (e.g., 50%, 61.8%), or back to point A/B
---
### 📉 Sell Setup (Bearish Shark)
1. **No fixed retracement for A**
2. **B extends 113%–161.8% of XA**
3. **C completes at**:
- 88.6%–113% of OX
- 161.8%–224% of AB
📍 **Entry**: Near point C
📍 **Stop Loss**: Above point C
📍 **Target**: Retracement levels of BC, or back to point A/B
---
### 📊 Real Trade Example & Educational Resources
In the comment
Disclaimer
The information and publications are not meant to be, and do not constitute, financial, investment, trading, or other types of advice or recommendations supplied or endorsed by TradingView. Read more in the Terms of Use.
Disclaimer
The information and publications are not meant to be, and do not constitute, financial, investment, trading, or other types of advice or recommendations supplied or endorsed by TradingView. Read more in the Terms of Use.